Home / Introduction To UV-Vis Spectroscopy
Spectroscopy
Introduction To UV-Vis Spectroscopy
Last updated: September 24th, 2025 |
Understanding UV-Vis Spectroscopy Will Make You More Fun At Parties
In today’s post we’ll discuss why most molecules are colourless, introduce the useful technique of UV-visible spectroscopy, and finally explain why molecules like chlorophyll and β-carotene are coloured.
We’ll even finish by showing you how to use a UV-Vis spectrum to predict the color of a molecule, which is a great trick to roll out at parties. No, seriously, it’s incredible. We’re talking about understanding the chemistry of colour, everyone! It doesn’t get better than this.
First, the summary. We’ll walk through the details below.
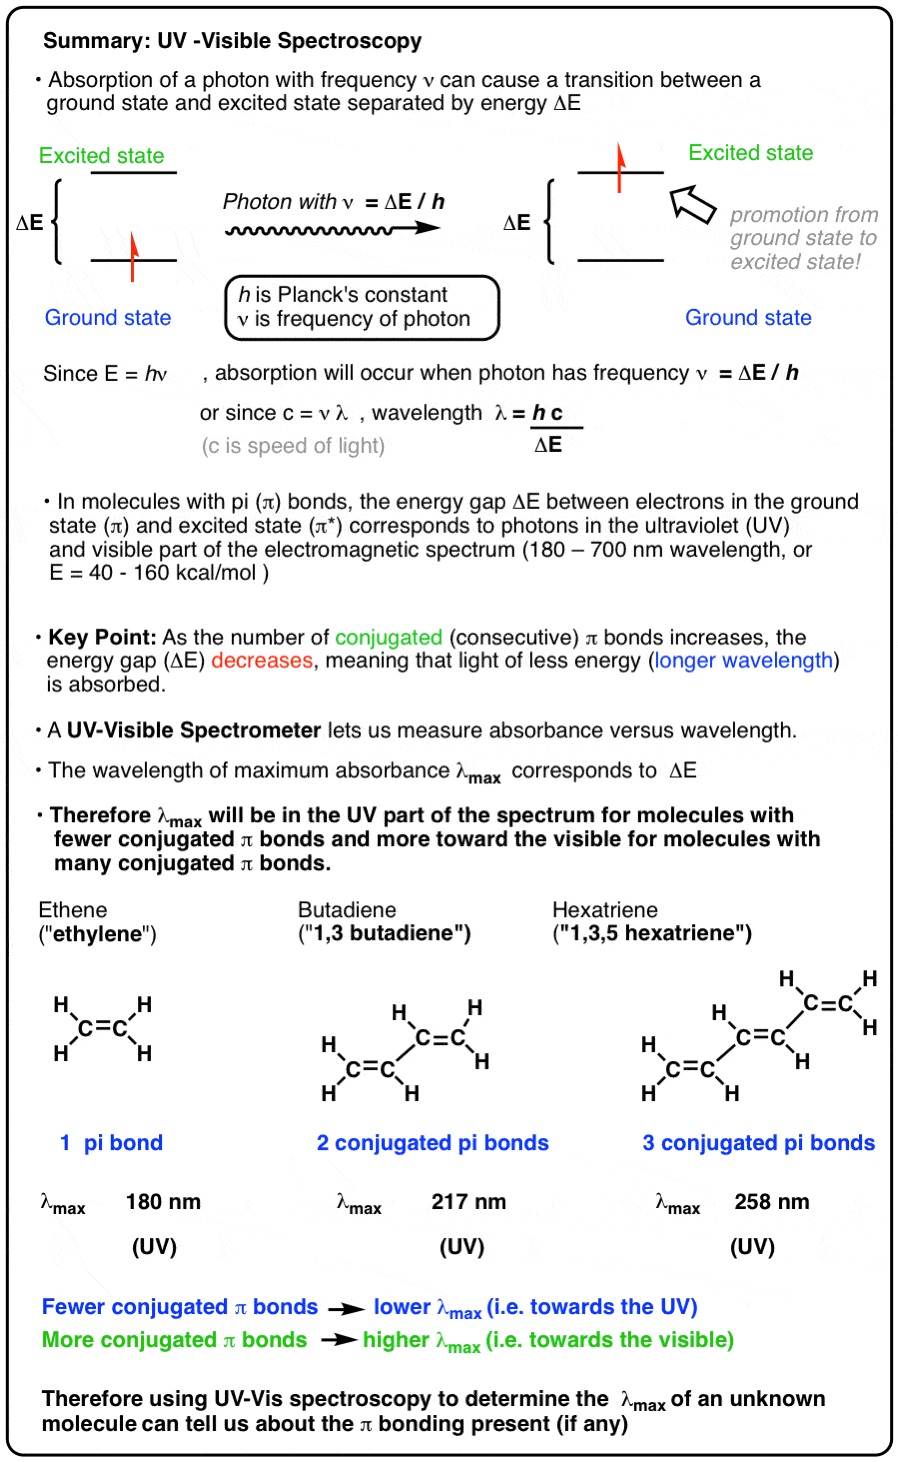
Table of Contents
- Converting Frequency Units Into Energy Units
- Ground State Electrons Can Be Promoted To Excited States Through The Absorption Of Light
- Case Study: The Molecular Orbital Diagram Of H2
- Why Most Molecules Containing Only Single Bonds Are Colorless
- Pi Bonds Absorb At Longer, More Energetically Accessible Wavelengths
- The UV-Vis Spectrometer
- How Does Conjugation Of Pi Bonds Affect Lambda Max?
- How Does Lambda Max Relate To The Color We Perceive?
- Conclusion: UV-Vis Spectroscopy
- Notes
- Quiz Yourself!
1. Converting The Frequency Of Light Into Energy Units
If you want someone to read something you’ve wrote, starting with an equation is generally a bad idea. However, we’re going to start with one of the most beautiful, amazing, and just plain useful equations in all of science. So if you drop off after reading this, really, that’s your problem.
From general chemistry, you may recall the immortal equation
E = hν
where E is energy, h is Planck’s constant (6.626 × 10⁻³⁴ m2 kg / s ) and ν is frequency (in m-1) .
Why is this equation so frickin’ useful? Because it relates energy to the frequency of light.
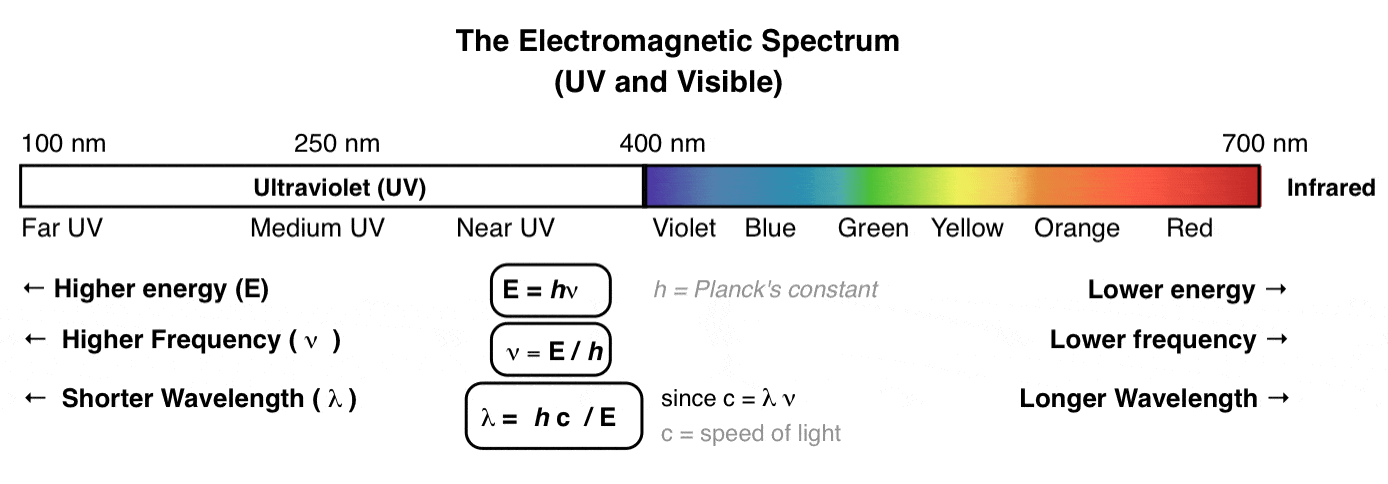
To be more specific, when I say “light” I mean, “photon”, as in a carrier of electromagnetic radiation. For the purposes of today’s post, here’s the part of the electromagnetic spectrum we’ll be discussing today: the UV and visible frequencies.
2. Ground State Electrons Can Be Promoted To Excited States Through The Absorption of Light
Way back in general chemistry (Bohr model of the hydrogen atom, anyone?) you saw how an electron can be promoted from the ground state orbital to an excited-state orbital through the absorption of a photon of frequency:
ν = ΔE / h
[where ΔE is the difference in energy between the ground and excited states].
Since it is an electron that is being promoted from one energy level to another, we call these “electronic transitions“. Generally, the frequency of radiation required for electronic transitions is in the ultraviolet and visible portion of the electromagnetic spectrum.
This has practical importance in a great number of ways, but for our purposes, we’ll see that the most prominent is that light can promote electrons from bonding orbitals to anti bonding orbitals, and therefore potentially lead to the breaking of chemical bonds.
This will help us to understand:
- why molecules absorb UV light in the first place (sigma -> sigma* transitions)
- why UV radiation is extremely harmful (especially far-UV radiation)
- and ultimately, why certain molecules have color (pi –> pi* transitions)
Let’s start with the simplest molecule, hydrogen (H2) and build from there.
3. Case Study: The Molecular Orbital Diagram For of Molecular Hydrogen (H2)
In the beginning of your organic chemistry course, you likely saw how atomic orbitals can overlap to form molecular orbitals.
In hydrogen (H2), for example, two 1s atomic orbitals overlap to form two sigma ( σ) molecular orbitals. The number of orbitals is always conserved: since we start with two atomic orbitals, we end up with two molecular orbitals.
Constructive overlap leads to the formation of the lower-energy sigma ( σ )orbital. Destructive overlap leads to the formation of the higher energy sigma star (σ*) orbital. These two orbitals differ by energy ΔE .
Since each hydrogen atom brings one electron to the party, we have two electrons to fill up our molecular orbitals with, and they will fill up the lower energy orbitals first – much like how nobody chooses to stand in the aisle of a city bus (higher energy) when an empty seat is present (lower energy).
This gives us a diagram that looks like this: (If you find this intimidating, just focus on that red ΔE).
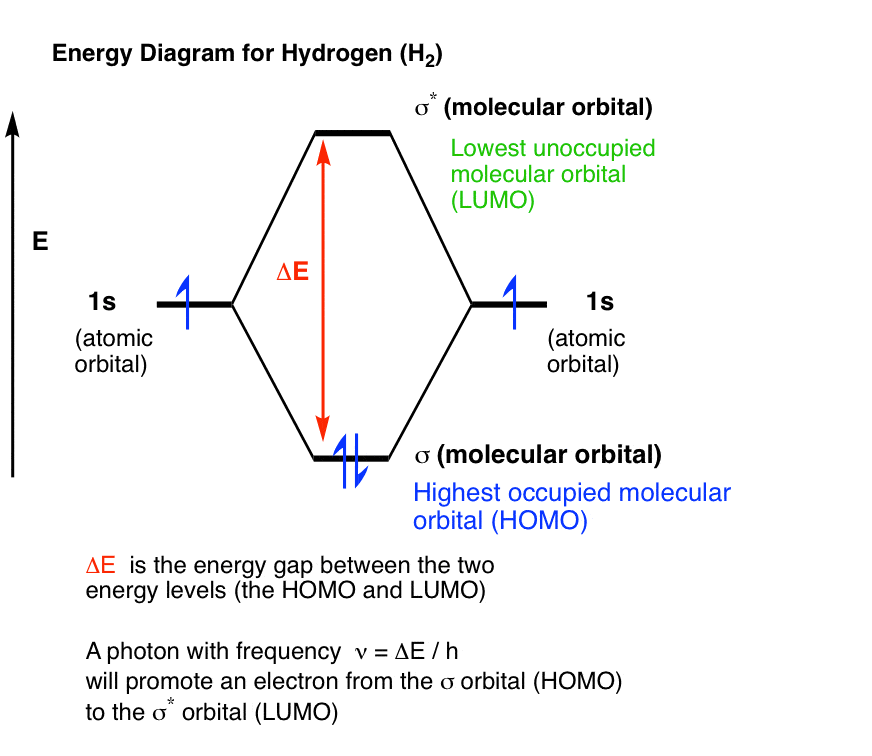
That ΔE is important: by analogy to the Bohr model, if molecular hydrogen (H2) is exposed to light of frequency
ν = ΔE / h
an electron will be promoted from the ground state (sigma) molecular orbital (the highest occupied molecular orbital, or HOMO) to the excited sigma* molecular orbital (the lowest unoccupied molecular orbital or LUMO).
It’s a bit like how toddlers climb stairs, one step at a time: one foot ascends from the highest occupied step to the lowest unoccupied step, and the energy necessary to do this is determined by the difference in height between the steps.
Now, we can convert frequency to wavelength through the equation
c = ν λ (c is the speed of light, λ is wavelength).
For the H-H bond in H2, ΔE corresponds to a measured absorption wavelength maximum of 112 nm, which is deep, deep, deep in the UV region of the electromagnetic spectrum.
4. Why Most Molecules Containing Only Single Bonds Are Colourless
112 nm is not exactly the tanning-bed area of the UV. No, this is the death-ray part of the UV spectrum. That’s because UV radiation below 120 nm is also where common sigma bonds like C-H and C-C absorb, and hence being exposed to far-UV light would quickly fragment the bonds that make up the proteins, sugars, and DNA present in our bodies and turn us to goo.
Let’s make this more clear.
Most single (i.e. sigma) bonds such as C-C, C-H, O-H, and C-O have ΔE values that correspond to light in the deep UV part of the spectrum. They appear colourless to us because light in the visible region (400-700 nm) simply doesn’t have enough energy to excite their bonding electrons to an excited state.
This is why water is colourless. This is why ethanol is colourless. This is why diethyl ether, hexanes, chloroform, and a host of other molecules you encounter both in the lab and in everyday life are colourless: the ΔE for the bonding orbitals is too large for relatively low-energy photons of visible light to excite them. [Insert Jeb Bush joke?]
In fact, UV in the region below 120 nm is so energetic, it is completely absorbed by atmospheric O2 and N2. In other words, if you want to measure the exact wavelengths that , say, ethanol absorbs at, you would need to place it in a vacuum chamber and expose it to hard UV light. This is of academic interest, sure, but outside the scope of a typical intro course. For our purposes, we won’t discuss sigma → sigma* transitions further.
Bottom line: we don’t generally observe sigma → sigma* transitions.
[One exception that we do encounter are dihalogens like Cl2 and I2 that can absorb visible light to generate free radicals through homolytic cleavage of sigma bonds . This is an example of breaking sigma bonds through absorption of UV or visible light, made possible because these bonds are quite weak, about 50-60 kcal/mol, and the corresponding ΔE is small ].
5. Pi ( π) bonds absorb at longer, more accessible wavelengths
OK: we’re going to ignore σ→σ* transitions. So let’s talk about π-π* transitions instead.
This is where it gets interesting and relevant.
Let’s remind ourself of what we’re talking about by starting with a simple molecule. Here’s ethene (a.k.a. “ethylene”), the simplest alkene. A quick look at its structure reveals 5 sigma bonds and one pi bond.
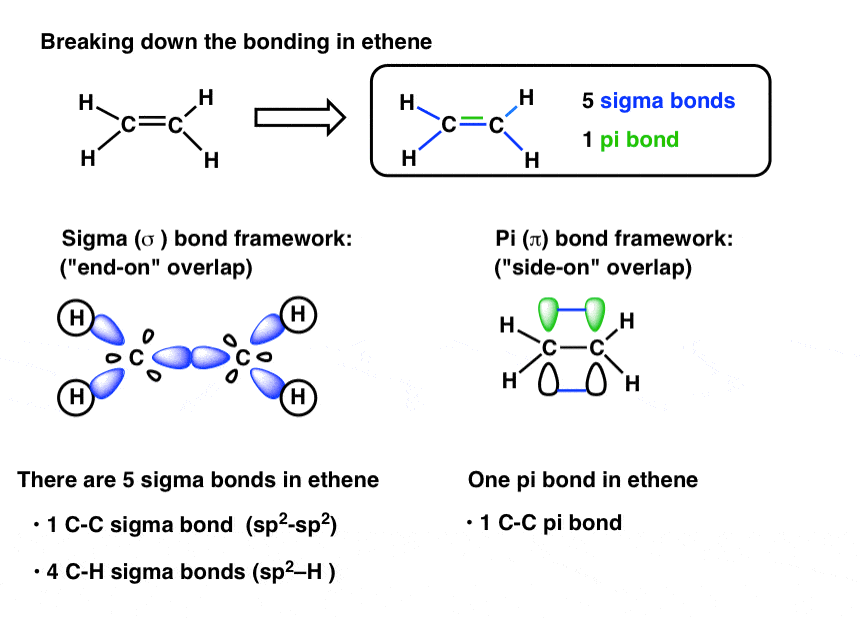
- Recall that sigma bonds are the result of “end-on” overlap between s or spn (sp, sp2, or sp3) orbitals , whereas pi bonds result from the “side-on” bonding of adjacent p orbitals.
- All else being equal, π bonds are weaker than the comparable sigma bonds, because there is less orbital overlap.
- Weaker bonds mean that the energy gap ΔE between the π (HOMO) and π* (LUMO) will be correspondingly smaller. [In our analogy, a shorter step in a staircase requires less energy to climb].
- Since ΔE is smaller for a pi bond, this corresponds to a longer wavelength (of lower frequency) required to excite an electron from the pi to the pi* orbital.
For ethene, the wavelength absorption maximum for this pi-pi* transition is about 170 nm: still in the deep UV, but not as extreme as for the corresponding C-C sigma bond.
We’d expect ethylene to be colourless, and it is: it just absorbs a somewhat closer to the visible portion of the spectrum than, say, ethane.
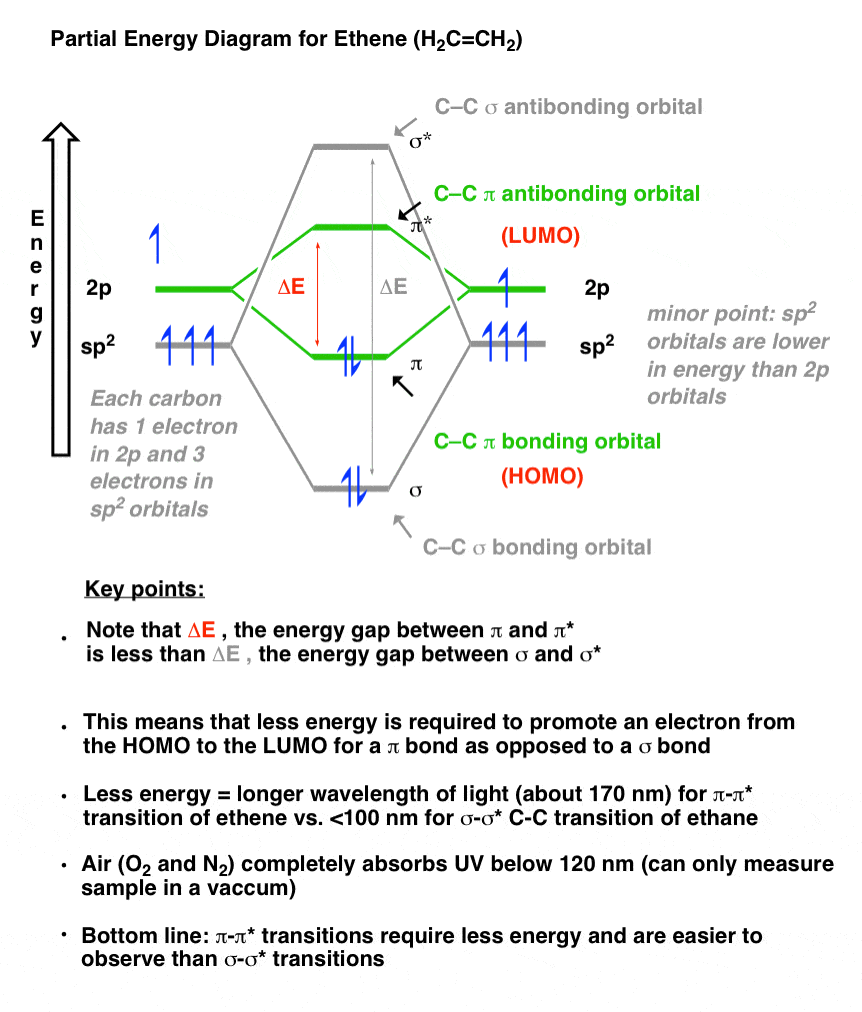
Let’s illustrate this with a figure that often looks scary to students: an orbital energy diagram.
*Trigger Warning* All this figure is trying to show is that ΔE for the C-C π bond (in green) is smaller than ΔE for the C-C σ bond (in grey). If you get that, you’ve grasped the key point.*
Wait a second, you might say. How do we know that ethene absorbs light in the UV around 170 nm?
Glad you asked. Let’s introduce a very important device called a UV-Vis Spectrometer.
6. The UV-Vis Spectrometer
The basic idea behind UV-Vis spectroscopy is to shine light of varying wavelengths through a sample and to measure the absorbance at each wavelength. Only the wavelengths corresponding to the ΔE for an electronic transition will be strongly absorbed. [For a schematic of how the spectrometer works: check this excellent page, which is also an excellent alternative explanation of UV].
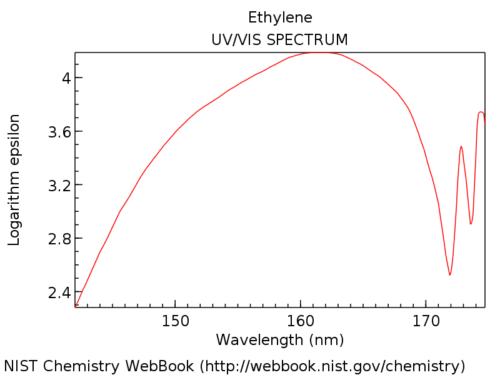
A UV-Vis spectrum plots absorbance (or its inverse, transmittance) of the sample versus wavelength. Here’s the spectrum for ethene. [In this case the wavelength is plotted versus transmittance, the inverse of absorbance (high absorbance = low transmittance, and vice versa). ]
Note that the wavelength of maximum transmittance is at 174 nm. We call this λmax , pronounced “lambda max”. Very little light passes through the sample at this wavelength, because the wavelength corresponds very closely to ΔE for the π to π* transition.
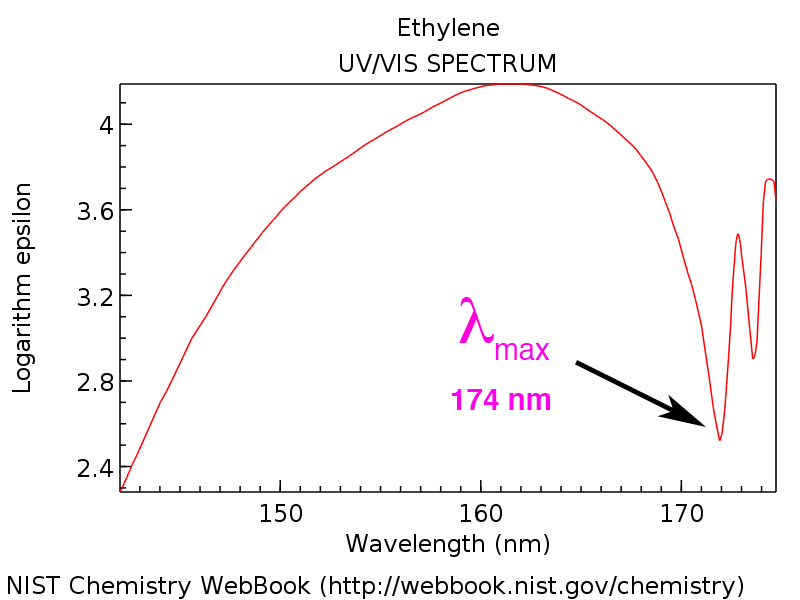
The UV-Vis spectrometer is a useful tool because it allows us to nail down exactly where samples absorb light, and thus quantify electronic transitions. For example, knowing that the λmax for ethene is at 174 nm allows us to calculate the energy gap ΔE , which turns out to be about 164 kcal/mol.
7. How Does Conjugation Of Pi Bonds Affect λmax ?
In our previous post on natural pigments, we noted that their large number of conjugated pi bonds was responsible for their colors.
UV-Vis spectroscopy helps us to understand exactly how conjugation relates to the λmax of a molecule – and thus, its color (or lack thereof).
For example, let’s look at what happens to λmax when we increase the conjugation length from 1 (ethene) to 2 (butadiene) to 3 (hexatriene).
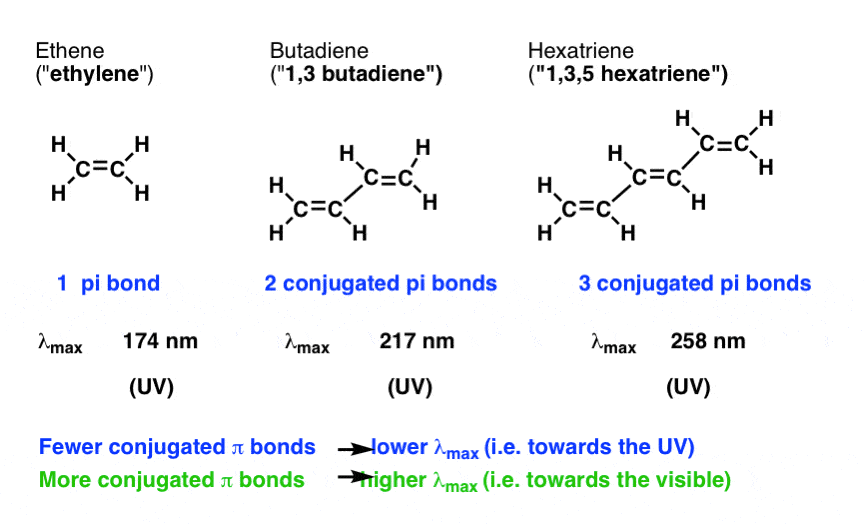
As the number of conjugated pi bonds increases, the λmax increases as well!
Because longer frequency = smaller energy, this means that the energy gap ΔE between the highest-occupied molecular orbital (HOMO) and lowest unoccupied molecular orbital (LUMO) decreases as the number of conjugated pi bonds increases.
For kicks, here’s what the bonding picture (roughly) looks like. Again, just focus on the ΔE: it gets smaller as the number of conjugated pi bonds increases.
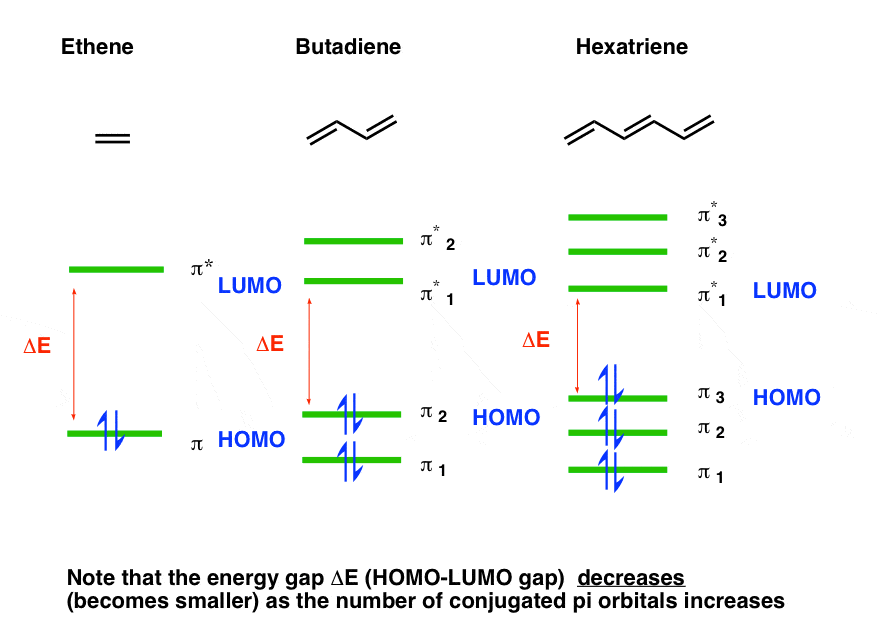
As this trend continues past hexatriene toward molecules with longer conjugation length, λmax starts to creep into the visible region of the spectrum. It’s already at 258 nm for a conjugation length of 3. Color starts to appear when the conjugation length approaches 7 or so. [For instance, Amphotericin B has 7 conjugated pi bonds and absorbs around 403 nm, in the violet.]
Our old friends lycopene (λmax 471 nm), β-carotene (λmax 452 nm) and lutein (λmax 445 nm) have even larger pi systems (10 and 11) and absorb visible light further towards the red. [Note 2]
Thus, the λmax of molecules are largely a function of the conjugation length: as conjugation number increases, so does λmax.
But one question remains:
8. How Does λmax Relate To The Color We Perceive?
One last piece of the puzzle. How does the wavelength of maximum absorbance (λmax) relate to the actual color?
First, a refresher from the last post. We see the complementary colour of the major color that is absorbed. A molecule that absorbs in the blue will appear orange, because we perceive the colors that are reflected, and orange is the complementary color of blue.
For example, this molecule, Rhodamine B [Note 3] absorbs at about 560 nm (green) and appears red , the complimentary color of green.
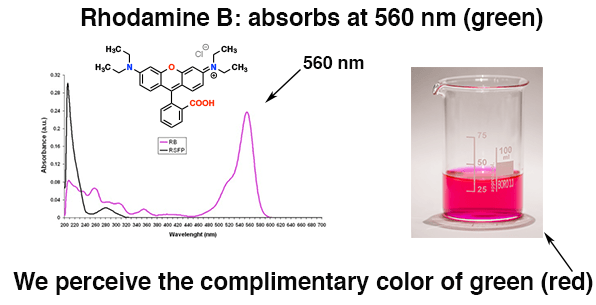
Knowing where a molecule absorbs visible light allows us to make predictions about its color. Interesting!
That is a pretty badass cocktail party trick, I think. Think about that the next time you look at a leaf, a tomato, a carrot, or yellow crayfish blood.
We could go on (and we will!) . But let’s leave it there for now.
BTW: A fantastic treatment of UV-Vis spectroscopy with less jibber-jabber has been written by Tim Soderbergh over at LibreText. Check it out.
Also, Reusch’s online textbook entry on UV-Vis spectroscopy is more in-depth and richer in deep detail on this topic than this post is.
9. Conclusion: UV-Vis Spectroscopy
This post has walked through some of the theory behind UV-Vis spectra.
In the next post, we’ll go into some of the more practical aspects of UV-Vis spectroscopy. What kind of questions can UV-Vis help us answer about an unknown molecule?
Notes
Related Articles
Note 1. What’s missing from this discussion?
The λmaxisn’t solely a function of the number of pi bonds. If that were true, lycopene (11 conjugated pi bonds) and b-carotene (also with 11 conjugated pi bonds) would have the exact same color. They don’t, since λmax is also impacted by substituents such as attached alkyl groups, whether the pi bond is interior or exterior to a ring (endocyclic / exocyclic) and attached heteroatoms.
Back in the 1940s when UV-Vis was practically the only spectroscopic method available, Woodward and Fieser developed a set of empirical rules (the Woodward-Fieser rules) that aim to predict the λmax based on a number of structural factors. Variants of these rules for more complex conjugated systems also exist (Fieser-Kuhn rules).
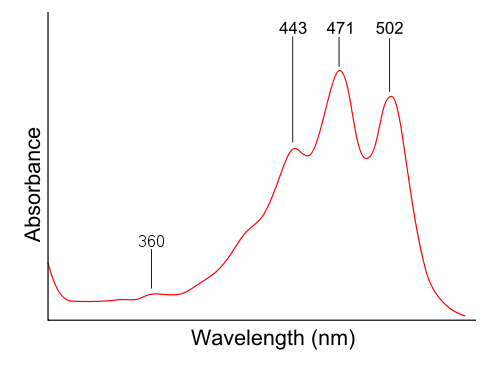
Note 2. I would have liked to have used the UV-vis spectra of natural pigments like lycopene and chlorophyll as examples, but they contain more than one maximum. This isn’t easy to explain. Hence it isn’t as straightforward to translate into a color as Rhodamine B is. Here’s lycopene, for instance (source: wikipedia)
Note 3. Also missing here is why UV-Vis spectra are broad and not straight lines. For instance, if, say, rhodamine has a delta E that corresponds to light of 560 nm, why does it also absorb light at 559 and 561 nm ? Part of the answer is that the bonds are in constant vibration and this adjusts the value of delta E, so that a range of energies are absorbed.
Note 4. [How far can we take this? At the far extreme, you have graphene, which is just a big flat conjugated pi system with a near infinite number of conjugated pi bonds. In this situation pretty much every wavelength of light corresponds to some kind of pi-pi* transition, and the result is a black color .]
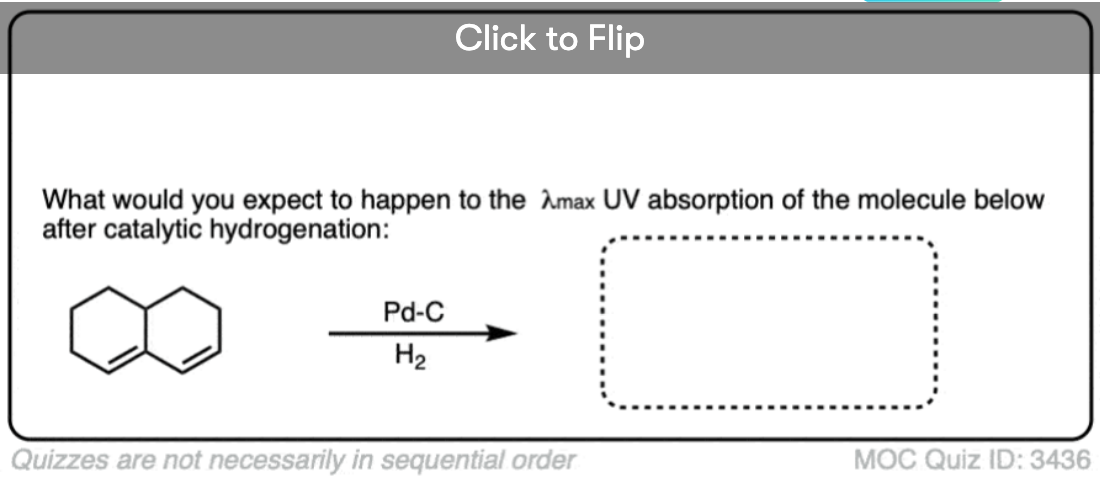
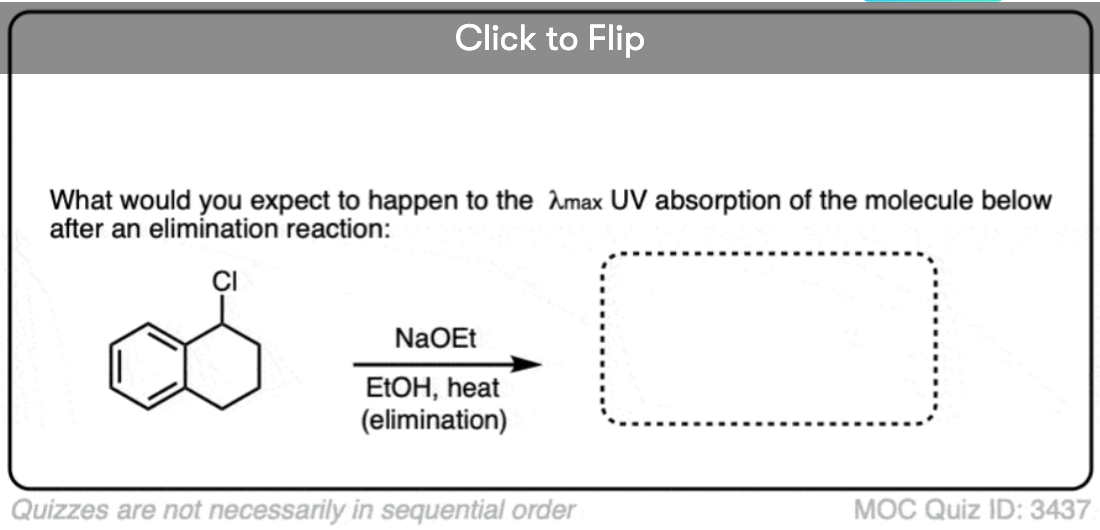
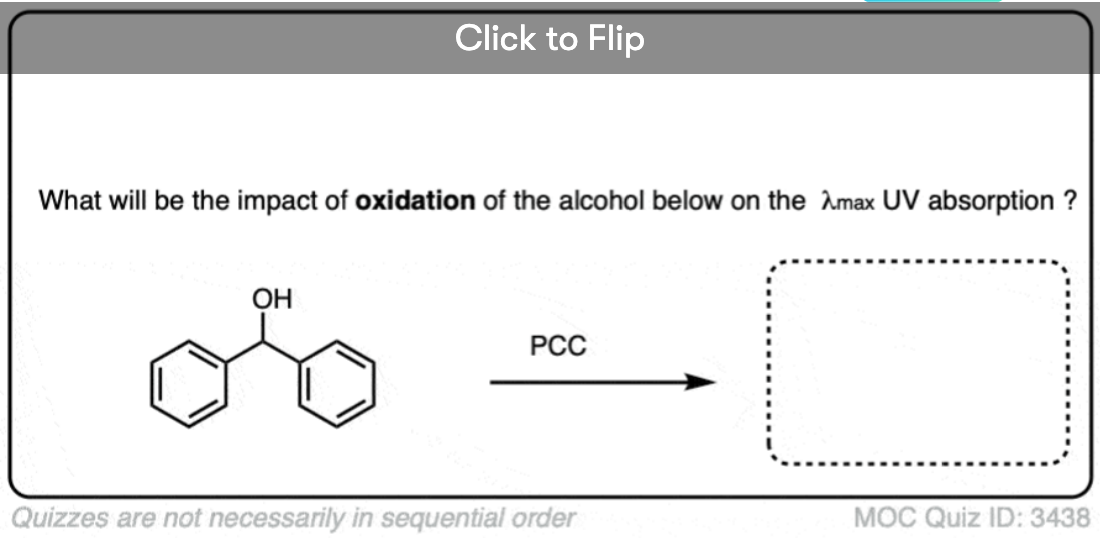
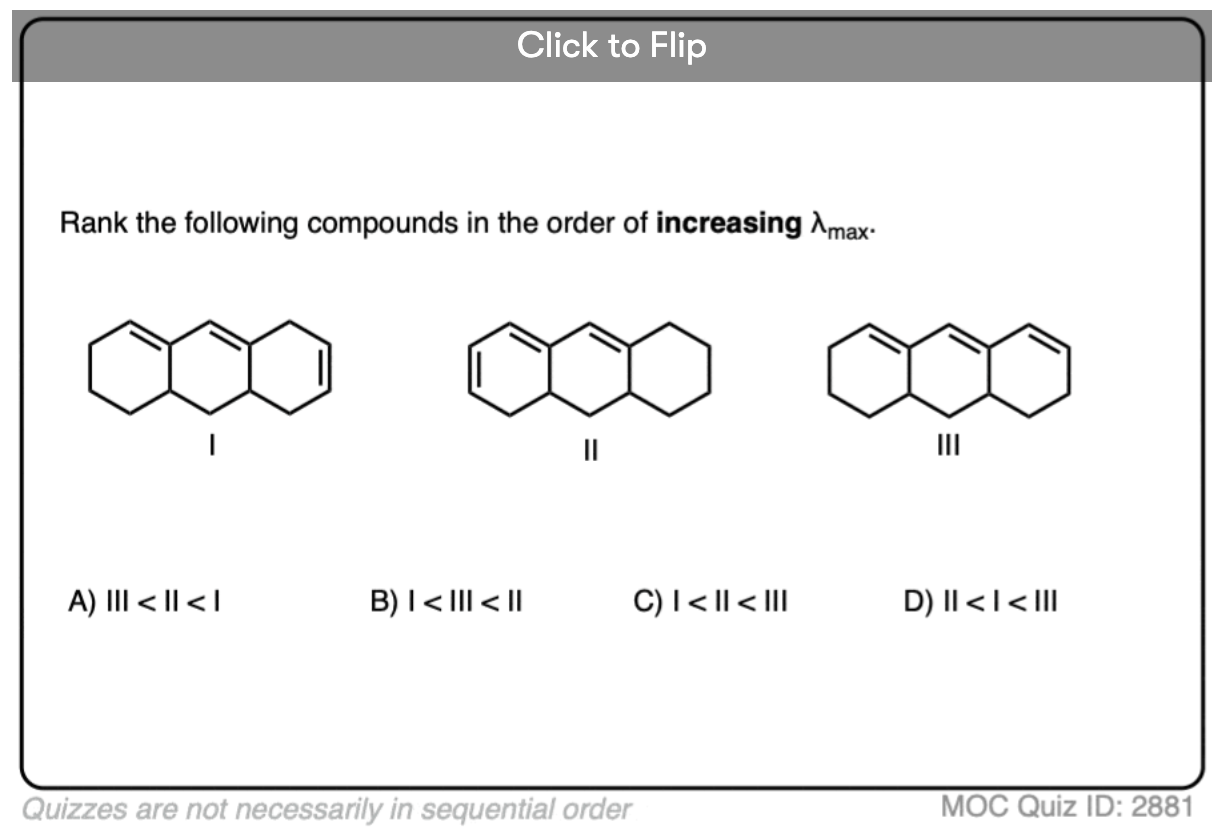
Quiz Yourself!
Become a MOC member to see the clickable quiz with answers on the back.
Become a MOC member to see the clickable quiz with answers on the back.
Become a MOC member to see the clickable quiz with answers on the back.
Become a MOC member to see the clickable quiz with answers on the back.
Become a MOC member to see the clickable quiz with answers on the back.
00 General Chemistry Review
01 Bonding, Structure, and Resonance
- How Do We Know Methane (CH4) Is Tetrahedral?
- Hybrid Orbitals and Hybridization
- How To Determine Hybridization: A Shortcut
- Orbital Hybridization And Bond Strengths
- Sigma bonds come in six varieties: Pi bonds come in one
- Dipole Moments and Dipoles
- A Key Skill: How to Calculate Formal Charge
- The Four Intermolecular Forces and How They Affect Boiling Points
- 3 Trends That Affect Boiling Points
- How To Use Electronegativity To Determine Electron Density (and why NOT to trust formal charge)
- Introduction to Resonance
- How To Use Curved Arrows To Interconvert Resonance Structures
- Evaluating Resonance Structures - The Fewer Charges, The Better
- How To Find The Best Resonance Structure By Applying Electronegativity
- Resonance Structures Should Have Full Octets (If Possible!)
- Resonance Structures: Negative Charges Are Best Placed On The Least Basic Atom
- Pi-Donation and Pi-Donors
- Exploring Resonance: Pi-acceptors
- In Summary: How To Evaluate Resonance Structures
- Drawing Resonance Structures: 3 Common Mistakes To Avoid
- How to apply electronegativity and resonance to understand reactivity
- Bond Hybridization Practice
- Structure and Bonding Practice Quizzes
- Resonance Structures Practice
02 Acid Base Reactions
- Introduction to Acid-Base Reactions
- Acid Base Reactions In Organic Chemistry
- Five Key Factors That Influence Acidity
- Factors That Affect Base Strength In Organic Chemistry
- Acid-Base Reactions: Introducing Ka and pKa
- How to Use a pKa Table
- The pKa Table Is Your Friend
- A Handy Rule of Thumb for Acid-Base Reactions
- Acid Base Reactions Are Fast
- pKa Values Span 60 Orders Of Magnitude
- How Protonation and Deprotonation Affect Reactivity
- Acid Base Practice Problems
03 Alkanes and Nomenclature
- Meet the (Most Important) Functional Groups
- Condensed Formulas: Deciphering What the Brackets Mean
- Hidden Hydrogens, Hidden Lone Pairs, Hidden Counterions
- Don't Be Futyl, Learn The Butyls
- Primary, Secondary, Tertiary, Quaternary In Organic Chemistry
- Branching, and Its Affect On Melting and Boiling Points
- The Many, Many Ways of Drawing Butane
- Wedge And Dash Convention For Tetrahedral Carbon
- Common Mistakes in Organic Chemistry: Pentavalent Carbon
- Table of Functional Group Priorities for Nomenclature
- Summary Sheet - Alkane Nomenclature
- Organic Chemistry IUPAC Nomenclature Demystified With A Simple Puzzle Piece Approach
- Boiling Point Quizzes
- Organic Chemistry Nomenclature Quizzes
04 Conformations and Cycloalkanes
- Staggered vs Eclipsed Conformations of Ethane
- Conformational Isomers of Propane
- Newman Projection of Butane (and Gauche Conformation)
- Introduction to Cycloalkanes
- Geometric Isomers In Small Rings: Cis And Trans Cycloalkanes
- Calculation of Ring Strain In Cycloalkanes
- Cycloalkanes - Ring Strain In Cyclopropane And Cyclobutane
- Cyclohexane Conformations
- Cyclohexane Chair Conformation: An Aerial Tour
- How To Draw The Cyclohexane Chair Conformation
- The Cyclohexane Chair Flip
- The Cyclohexane Chair Flip - Energy Diagram
- Substituted Cyclohexanes - Axial vs Equatorial
- Ranking The Bulkiness Of Substituents On Cyclohexanes: "A-Values"
- Cyclohexane Chair Conformation Stability: Which One Is Lower Energy?
- Fused Rings - Cis-Decalin and Trans-Decalin
- Naming Bicyclic Compounds - Fused, Bridged, and Spiro
- Bredt's Rule (And Summary of Cycloalkanes)
- Newman Projection Practice
- Cycloalkanes Practice Problems
05 A Primer On Organic Reactions
- The Most Important Question To Ask When Learning a New Reaction
- Curved Arrows (for reactions)
- Nucleophiles and Electrophiles
- The Three Classes of Nucleophiles
- Nucleophilicity vs. Basicity
- What Makes A Good Nucleophile?
- What Makes A Good Leaving Group?
- 3 Factors That Stabilize Carbocations
- Equilibrium and Energy Relationships
- 7 Factors that stabilize negative charge in organic chemistry
- 7 Factors That Stabilize Positive Charge in Organic Chemistry
- What's a Transition State?
- Hammond's Postulate
- Learning Organic Chemistry Reactions: A Checklist (PDF)
06 Free Radical Reactions
- Free Radical Reactions
- 3 Factors That Stabilize Free Radicals
- Bond Strengths And Radical Stability
- Free Radical Initiation: Why Is "Light" Or "Heat" Required?
- Initiation, Propagation, Termination
- Monochlorination Products Of Propane, Pentane, And Other Alkanes
- Selectivity In Free Radical Reactions
- Selectivity in Free Radical Reactions: Bromination vs. Chlorination
- Halogenation At Tiffany's
- Allylic Bromination
- Bonus Topic: Allylic Rearrangements
- In Summary: Free Radicals
- Synthesis (2) - Reactions of Alkanes
- Free Radicals Practice Quizzes
07 Stereochemistry and Chirality
- Types of Isomers: Constitutional Isomers, Stereoisomers, Enantiomers, and Diastereomers
- How To Draw The Enantiomer Of A Chiral Molecule
- How To Draw A Bond Rotation
- Introduction to Assigning (R) and (S): The Cahn-Ingold-Prelog Rules
- Assigning Cahn-Ingold-Prelog (CIP) Priorities (2) - The Method of Dots
- Enantiomers vs Diastereomers vs The Same? Two Methods For Solving Problems
- Assigning R/S To Newman Projections (And Converting Newman To Line Diagrams)
- How To Determine R and S Configurations On A Fischer Projection
- The Meso Trap
- Optical Rotation, Optical Activity, and Specific Rotation
- Optical Purity and Enantiomeric Excess
- What's a Racemic Mixture?
- Chiral Allenes And Chiral Axes
- Stereochemistry Practice Problems and Quizzes
08 Substitution Reactions
- Nucleophilic Substitution Reactions - Introduction
- Two Types of Nucleophilic Substitution Reactions
- The SN2 Mechanism
- Why the SN2 Reaction Is Powerful
- The SN1 Mechanism
- The Conjugate Acid Is A Better Leaving Group
- Comparing the SN1 and SN2 Reactions
- Polar Protic? Polar Aprotic? Nonpolar? All About Solvents
- Steric Hindrance is Like a Fat Goalie
- Common Blind Spot: Intramolecular Reactions
- Substitution Practice - SN1
- Substitution Practice - SN2
09 Elimination Reactions
- Elimination Reactions (1): Introduction And The Key Pattern
- Elimination Reactions (2): The Zaitsev Rule
- Elimination Reactions Are Favored By Heat
- Two Elimination Reaction Patterns
- The E1 Reaction
- The E2 Mechanism
- E1 vs E2: Comparing the E1 and E2 Reactions
- Antiperiplanar Relationships: The E2 Reaction and Cyclohexane Rings
- Bulky Bases in Elimination Reactions
- Comparing the E1 vs SN1 Reactions
- Elimination (E1) Reactions With Rearrangements
- E1cB - Elimination (Unimolecular) Conjugate Base
- Elimination (E1) Practice Problems And Solutions
- Elimination (E2) Practice Problems and Solutions
10 Rearrangements
11 SN1/SN2/E1/E2 Decision
- Identifying Where Substitution and Elimination Reactions Happen
- Deciding SN1/SN2/E1/E2 (1) - The Substrate
- Deciding SN1/SN2/E1/E2 (2) - The Nucleophile/Base
- SN1 vs E1 and SN2 vs E2 : The Temperature
- Deciding SN1/SN2/E1/E2 - The Solvent
- Wrapup: The Key Factors For Determining SN1/SN2/E1/E2
- Alkyl Halide Reaction Map And Summary
- SN1 SN2 E1 E2 Practice Problems
12 Alkene Reactions
- E and Z Notation For Alkenes (+ Cis/Trans)
- Alkene Stability
- Alkene Addition Reactions: "Regioselectivity" and "Stereoselectivity" (Syn/Anti)
- Stereoselective and Stereospecific Reactions
- Hydrohalogenation of Alkenes and Markovnikov's Rule
- Hydration of Alkenes With Aqueous Acid
- Rearrangements in Alkene Addition Reactions
- Halogenation of Alkenes and Halohydrin Formation
- Oxymercuration Demercuration of Alkenes
- Hydroboration Oxidation of Alkenes
- m-CPBA (meta-chloroperoxybenzoic acid)
- OsO4 (Osmium Tetroxide) for Dihydroxylation of Alkenes
- Palladium on Carbon (Pd/C) for Catalytic Hydrogenation of Alkenes
- Cyclopropanation of Alkenes
- A Fourth Alkene Addition Pattern - Free Radical Addition
- Alkene Reactions: Ozonolysis
- Oxidative Cleavage of Vicinal Diols With NaIO4 and Pb(OAc)4
- Summary: Three Key Families Of Alkene Reaction Mechanisms
- Synthesis (4) - Alkene Reaction Map, Including Alkyl Halide Reactions
- Alkene Reactions Practice Problems
13 Alkyne Reactions
- Acetylides from Alkynes, And Substitution Reactions of Acetylides
- Partial Reduction of Alkynes With Lindlar's Catalyst
- Partial Reduction of Alkynes With Na/NH3 To Obtain Trans Alkenes
- Alkyne Hydroboration With "R2BH"
- Hydration and Oxymercuration of Alkynes
- Hydrohalogenation of Alkynes
- Alkyne Halogenation: Bromination and Chlorination of Alkynes
- Oxidation of Alkynes With O3 and KMnO4
- Alkenes To Alkynes Via Halogenation And Elimination Reactions
- Alkynes Are A Blank Canvas
- Synthesis (5) - Reactions of Alkynes
- Alkyne Reactions Practice Problems With Answers
14 Alcohols, Epoxides and Ethers
- Alcohols - Nomenclature and Properties
- Alcohols Can Act As Acids Or Bases (And Why It Matters)
- Alcohols - Acidity and Basicity
- The Williamson Ether Synthesis
- Ethers From Alkenes, Tertiary Alkyl Halides and Alkoxymercuration
- Alcohols To Ethers via Acid Catalysis
- Cleavage Of Ethers With Acid
- Epoxides - The Outlier Of The Ether Family
- Opening of Epoxides With Acid
- Epoxide Ring Opening With Base
- Making Alkyl Halides From Alcohols
- Tosylates And Mesylates
- PBr3 and SOCl2
- Elimination Reactions of Alcohols
- Elimination of Alcohols To Alkenes With POCl3
- Alcohol Oxidation: "Strong" and "Weak" Oxidants
- Demystifying The Mechanisms of Alcohol Oxidations
- Protecting Groups For Alcohols
- Thiols And Thioethers
- Calculating the oxidation state of a carbon
- Oxidation and Reduction in Organic Chemistry
- Oxidation Ladders
- SOCl2 Mechanism For Alcohols To Alkyl Halides: SN2 versus SNi
- Alcohol Reactions Roadmap (PDF)
- Alcohol Reaction Practice Problems
- Epoxide Reaction Quizzes
- Oxidation and Reduction Practice Quizzes
15 Organometallics
- What's An Organometallic?
- Formation of Grignard and Organolithium Reagents
- Organometallics Are Strong Bases
- Reactions of Grignard Reagents
- Protecting Groups In Grignard Reactions
- Synthesis Problems Involving Grignard Reagents
- Grignard Reactions And Synthesis (2)
- Organocuprates (Gilman Reagents): How They're Made
- Gilman Reagents (Organocuprates): What They're Used For
- The Heck, Suzuki, and Olefin Metathesis Reactions (And Why They Don't Belong In Most Introductory Organic Chemistry Courses)
- Reaction Map: Reactions of Organometallics
- Grignard Practice Problems
16 Spectroscopy
- Degrees of Unsaturation (or IHD, Index of Hydrogen Deficiency)
- Conjugation And Color (+ How Bleach Works)
- Introduction To UV-Vis Spectroscopy
- UV-Vis Spectroscopy: Absorbance of Carbonyls
- UV-Vis Spectroscopy: Practice Questions
- Bond Vibrations, Infrared Spectroscopy, and the "Ball and Spring" Model
- Infrared (IR) Spectroscopy: A Quick Primer On Interpreting Spectra
- IR Spectroscopy: 4 Practice Problems
- 1H NMR: How Many Signals?
- Homotopic, Enantiotopic, Diastereotopic
- Diastereotopic Protons in 1H NMR Spectroscopy: Examples
- 13-C NMR - How Many Signals
- Liquid Gold: Pheromones In Doe Urine
- Natural Product Isolation (1) - Extraction
- Natural Product Isolation (2) - Purification Techniques, An Overview
- Structure Determination Case Study: Deer Tarsal Gland Pheromone
17 Dienes and MO Theory
- What To Expect In Organic Chemistry 2
- Are these molecules conjugated?
- Conjugation And Resonance In Organic Chemistry
- Bonding And Antibonding Pi Orbitals
- Molecular Orbitals of The Allyl Cation, Allyl Radical, and Allyl Anion
- Pi Molecular Orbitals of Butadiene
- Reactions of Dienes: 1,2 and 1,4 Addition
- Thermodynamic and Kinetic Products
- More On 1,2 and 1,4 Additions To Dienes
- s-cis and s-trans
- The Diels-Alder Reaction
- Cyclic Dienes and Dienophiles in the Diels-Alder Reaction
- Stereochemistry of the Diels-Alder Reaction
- Exo vs Endo Products In The Diels Alder: How To Tell Them Apart
- HOMO and LUMO In the Diels Alder Reaction
- Why Are Endo vs Exo Products Favored in the Diels-Alder Reaction?
- Diels-Alder Reaction: Kinetic and Thermodynamic Control
- The Retro Diels-Alder Reaction
- The Intramolecular Diels Alder Reaction
- Regiochemistry In The Diels-Alder Reaction
- The Cope and Claisen Rearrangements
- Electrocyclic Reactions
- Electrocyclic Ring Opening And Closure (2) - Six (or Eight) Pi Electrons
- Diels Alder Practice Problems
- Molecular Orbital Theory Practice
18 Aromaticity
- Introduction To Aromaticity
- Rules For Aromaticity
- Huckel's Rule: What Does 4n+2 Mean?
- Aromatic, Non-Aromatic, or Antiaromatic? Some Practice Problems
- Antiaromatic Compounds and Antiaromaticity
- The Pi Molecular Orbitals of Benzene
- The Pi Molecular Orbitals of Cyclobutadiene
- Frost Circles
- Aromaticity Practice Quizzes
19 Reactions of Aromatic Molecules
- Electrophilic Aromatic Substitution: Introduction
- Activating and Deactivating Groups In Electrophilic Aromatic Substitution
- Electrophilic Aromatic Substitution - The Mechanism
- Ortho-, Para- and Meta- Directors in Electrophilic Aromatic Substitution
- Understanding Ortho, Para, and Meta Directors
- Why are halogens ortho- para- directors?
- Disubstituted Benzenes: The Strongest Electron-Donor "Wins"
- Electrophilic Aromatic Substitutions (1) - Halogenation of Benzene
- Electrophilic Aromatic Substitutions (2) - Nitration and Sulfonation
- EAS Reactions (3) - Friedel-Crafts Acylation and Friedel-Crafts Alkylation
- Intramolecular Friedel-Crafts Reactions
- Nucleophilic Aromatic Substitution (NAS)
- Nucleophilic Aromatic Substitution (2) - The Benzyne Mechanism
- Reactions on the "Benzylic" Carbon: Bromination And Oxidation
- The Wolff-Kishner, Clemmensen, And Other Carbonyl Reductions
- More Reactions on the Aromatic Sidechain: Reduction of Nitro Groups and the Baeyer Villiger
- Aromatic Synthesis (1) - "Order Of Operations"
- Synthesis of Benzene Derivatives (2) - Polarity Reversal
- Aromatic Synthesis (3) - Sulfonyl Blocking Groups
- Birch Reduction
- Synthesis (7): Reaction Map of Benzene and Related Aromatic Compounds
- Aromatic Reactions and Synthesis Practice
- Electrophilic Aromatic Substitution Practice Problems
20 Aldehydes and Ketones
- What's The Alpha Carbon In Carbonyl Compounds?
- Nucleophilic Addition To Carbonyls
- Aldehydes and Ketones: 14 Reactions With The Same Mechanism
- Sodium Borohydride (NaBH4) Reduction of Aldehydes and Ketones
- Grignard Reagents For Addition To Aldehydes and Ketones
- Wittig Reaction
- Hydrates, Hemiacetals, and Acetals
- Imines - Properties, Formation, Reactions, and Mechanisms
- All About Enamines
- Breaking Down Carbonyl Reaction Mechanisms: Reactions of Anionic Nucleophiles (Part 2)
- Aldehydes Ketones Reaction Practice
21 Carboxylic Acid Derivatives
- Nucleophilic Acyl Substitution (With Negatively Charged Nucleophiles)
- Addition-Elimination Mechanisms With Neutral Nucleophiles (Including Acid Catalysis)
- Basic Hydrolysis of Esters - Saponification
- Transesterification
- Proton Transfer
- Fischer Esterification - Carboxylic Acid to Ester Under Acidic Conditions
- Lithium Aluminum Hydride (LiAlH4) For Reduction of Carboxylic Acid Derivatives
- LiAlH[Ot-Bu]3 For The Reduction of Acid Halides To Aldehydes
- Di-isobutyl Aluminum Hydride (DIBAL) For The Partial Reduction of Esters and Nitriles
- Amide Hydrolysis
- Thionyl Chloride (SOCl2) And Conversion of Carboxylic Acids to Acid Halides
- Diazomethane (CH2N2)
- Carbonyl Chemistry: Learn Six Mechanisms For the Price Of One
- Making Music With Mechanisms (PADPED)
- Carboxylic Acid Derivatives Practice Questions
22 Enols and Enolates
- Keto-Enol Tautomerism
- Enolates - Formation, Stability, and Simple Reactions
- Kinetic Versus Thermodynamic Enolates
- Aldol Addition and Condensation Reactions
- Reactions of Enols - Acid-Catalyzed Aldol, Halogenation, and Mannich Reactions
- Claisen Condensation and Dieckmann Condensation
- Decarboxylation
- The Malonic Ester and Acetoacetic Ester Synthesis
- The Michael Addition Reaction and Conjugate Addition
- The Robinson Annulation
- Haloform Reaction
- The Hell–Volhard–Zelinsky Reaction
- Enols and Enolates Practice Quizzes
23 Amines
- The Amide Functional Group: Properties, Synthesis, and Nomenclature
- Basicity of Amines And pKaH
- 5 Key Basicity Trends of Amines
- The Mesomeric Effect And Aromatic Amines
- Nucleophilicity of Amines
- Alkylation of Amines (Sucks!)
- Reductive Amination
- The Gabriel Synthesis
- Some Reactions of Azides
- The Hofmann Elimination
- The Hofmann and Curtius Rearrangements
- The Cope Elimination
- Protecting Groups for Amines - Carbamates
- The Strecker Synthesis of Amino Acids
- Introduction to Peptide Synthesis
- Reactions of Diazonium Salts: Sandmeyer and Related Reactions
- Amine Practice Questions
24 Carbohydrates
- D and L Notation For Sugars
- Pyranoses and Furanoses: Ring-Chain Tautomerism In Sugars
- What is Mutarotation?
- Reducing Sugars
- The Big Damn Post Of Carbohydrate-Related Chemistry Definitions
- The Haworth Projection
- Converting a Fischer Projection To A Haworth (And Vice Versa)
- Reactions of Sugars: Glycosylation and Protection
- The Ruff Degradation and Kiliani-Fischer Synthesis
- Isoelectric Points of Amino Acids (and How To Calculate Them)
- Carbohydrates Practice
- Amino Acid Quizzes
25 Fun and Miscellaneous
- A Gallery of Some Interesting Molecules From Nature
- Screw Organic Chemistry, I'm Just Going To Write About Cats
- On Cats, Part 1: Conformations and Configurations
- On Cats, Part 2: Cat Line Diagrams
- On Cats, Part 4: Enantiocats
- On Cats, Part 6: Stereocenters
- Organic Chemistry Is Shit
- The Organic Chemistry Behind "The Pill"
- Maybe they should call them, "Formal Wins" ?
- Why Do Organic Chemists Use Kilocalories?
- The Principle of Least Effort
- Organic Chemistry GIFS - Resonance Forms
- Reproducibility In Organic Chemistry
- What Holds The Nucleus Together?
- How Reactions Are Like Music
- Organic Chemistry and the New MCAT
26 Organic Chemistry Tips and Tricks
- Common Mistakes: Formal Charges Can Mislead
- Partial Charges Give Clues About Electron Flow
- Draw The Ugly Version First
- Organic Chemistry Study Tips: Learn the Trends
- The 8 Types of Arrows In Organic Chemistry, Explained
- Top 10 Skills To Master Before An Organic Chemistry 2 Final
- Common Mistakes with Carbonyls: Carboxylic Acids... Are Acids!
- Planning Organic Synthesis With "Reaction Maps"
- Alkene Addition Pattern #1: The "Carbocation Pathway"
- Alkene Addition Pattern #2: The "Three-Membered Ring" Pathway
- Alkene Addition Pattern #3: The "Concerted" Pathway
- Number Your Carbons!
- The 4 Major Classes of Reactions in Org 1
- How (and why) electrons flow
- Grossman's Rule
- Three Exam Tips
- A 3-Step Method For Thinking Through Synthesis Problems
- Putting It Together
- Putting Diels-Alder Products in Perspective
- The Ups and Downs of Cyclohexanes
- The Most Annoying Exceptions in Org 1 (Part 1)
- The Most Annoying Exceptions in Org 1 (Part 2)
- The Marriage May Be Bad, But the Divorce Still Costs Money
- 9 Nomenclature Conventions To Know
- Nucleophile attacks Electrophile
27 Case Studies of Successful O-Chem Students
- Success Stories: How Corina Got The The "Hard" Professor - And Got An A+ Anyway
- How Helena Aced Organic Chemistry
- From a "Drop" To B+ in Org 2 – How A Hard Working Student Turned It Around
- How Serge Aced Organic Chemistry
- Success Stories: How Zach Aced Organic Chemistry 1
- Success Stories: How Kari Went From C– to B+
- How Esther Bounced Back From a "C" To Get A's In Organic Chemistry 1 And 2
- How Tyrell Got The Highest Grade In Her Organic Chemistry Course
- This Is Why Students Use Flashcards
- Success Stories: How Stu Aced Organic Chemistry
- How John Pulled Up His Organic Chemistry Exam Grades
- Success Stories: How Nathan Aced Organic Chemistry (Without It Taking Over His Life)
- How Chris Aced Org 1 and Org 2
- Interview: How Jay Got an A+ In Organic Chemistry
- How to Do Well in Organic Chemistry: One Student's Advice
- "America's Top TA" Shares His Secrets For Teaching O-Chem
- "Organic Chemistry Is Like..." - A Few Metaphors
- How To Do Well In Organic Chemistry: Advice From A Tutor
- Guest post: "I went from being afraid of tests to actually looking forward to them".
Thank you, James. We need a course on NMR.
Thanks for your awesome article.
I just have some questions:
For the Part 6 : The UV-Vis Spectrometer
For the graph plotted as wavelength vs transmittance:
it’s written lambda_max is the wavelength of maximum transmittance,
it should be wavelength of minimum transmittance (=max absorbance), right ?
And for the quantity on the y axis, why is it log(epsilon) ?
Because with Beer-Lambert (A = epsilon * c * L) if epsilon increases
then A increases too.
Which quantity sould it be ? – log(epsilon) ?
Excellent, but need to mention proper unit of physical quantity in the equation
U are the best organic chemist that have ever explained a complex topic in an easy way
How we define a compound is strongly UV Absorbed???
Its a very valuable and interesting information .
Thank you
Hello. I would like to kindly ask you if you could explain the influence of an heteroatom in a molecule, for example, the difference in lambda max between sulfur and iodine in CH3SH and CH3I?
I would appreciate it. Thank you
Nice info. regarding UV
Awesome Post! Please make a post for Woodward Feiser rules!
Hi Dipesh, I probably won’t since they’re readily available and are kind of an advanced topic, to be honest. But thanks for your kind comment. James
Thank you for that post! Please note that the unit for frequency is 1/s not 1/m (where you introduce the immortal E=hv).
Shoot. Thank you for the spot.
Interesting post. Simple yet very informative.
Very brilliant points. Thanks a lot. I learnt a lot of meanings which I was confused about them. The concepts were organized so shine and clear. By the way, can you explain about the n bonding electrons, as well?
Love your posts. In the figure for the electromagnetic spectrum, the symbols for wavelength and frequency are switched.
Thank you! Fixed!!
Excellent post, really enjoyed refreshing this basic knowledge.
Thank you.