Spectroscopy
Infrared (IR) Spectroscopy: A Quick Primer On Interpreting Spectra
Last updated: May 28th, 2026 |
How To Interpret IR Spectra In 1 Minute Or Less: The 2 Most Important Things To Look For [Tongue and Sword]
Last post, we briefly introduced the concept of bond vibrations, and we saw that we can think of covalent bonds as a bit like balls and springs: the springs vibrate, and each one “sings” at a characteristic frequency, which depends on the strength of the bond and on the masses of the atoms. These vibrations have frequencies that are in the mid-infrared (IR) region of the electromagnetic spectrum.
We can observe and measure this “singing” of bonds by applying IR radiation to a sample and measuring the frequencies at which the radiation is absorbed. The result is a technique known as Infrared Spectroscopy, which is a useful and quick tool for identifying the bonds present in a given molecule.
We saw that the IR spectrum of water was pretty simple – but moving on to a relatively complex molecule like glucose (below) we were suddenly confronted with a forest of peaks!
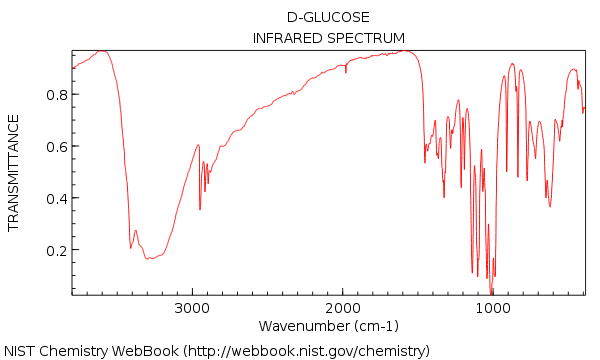
Your first impression of looking at that IR might be: agh! how am I supposed to make sense of that??
To which I want to say: don’t panic!
Table of Contents
- Let’s Correct Some Common Misconceptions About IR
- Starting With “Hunt And Peck” Is Not The Way To Go
- IR Spectroscopy: The Big Picture
- The Two Main Things To Look For In An IR Spectrum: “Tongues” and “Swords”.
- Alcohols and Carboxylic Acids: More Detail
- Specific Examples of IR Spectra of Carbonyl Functional Groups
- Less Crucial, But Still Useful: Two More Very Diagnostic Areas.
- Glucose, Revisited: The 1 Minute Analysis
- Quiz Yourself!
- Notes
1. Let’s Correct Some Common Misconceptions About IR
In this post, I want to show that a typical analysis of an IR spectrum is much simpler than you might think. In fact, once you learn what to look for, it can often be done in a minute or less. Why?
- IR is not generally used to determine the whole structure of an unknown molecule. For example, there isn’t a person alive who could look at the IR spectrum above and deduce the structure of glucose from it. IR is a tool with a very specific use. [Back in 1945 when IR was one of the few spectral techniques available, it was necessary to spend a lot more time trying to squeeze every last bit of information out of the spectrum. Today, with access to NMR and other techniques, we can do more cherry-picking]
- We don’t need to analyze every single peak ! (as we’ll see later, that’s what NMR is for : – ) ). Instead, IR is great for identifying certain specific functional groups, like alcohols and carbonyls. In this way it’s complimentary to other techniques (like NMR) which don’t yield this information as quickly.
With this in mind, we can simplify the analysis of an IR spectrum by cutting out everything except the lowest-lying fruit.
See that forest of peaks from 500-1400 cm-1 ? We’re basically going to ignore them all!
80% of the most useful information for our purposes can be obtained by looking at two specific areas of the spectrum: 3200-3400 cm-1 and 1650-1800 cm-1. We’ll also see that there are at least two more regions of an IR spectrum worth glancing at, and thus conclude a “first-order” analysis of the IR spectrum of an unknown. [We might write a subsequent post which gets nittier and grittier about the finer points of analyzing an IR spectrum]
Bottom line: The purpose of this post is to show you how to prioritize your time in an analysis of an IR spectrum.
[BTW: all spectra are from the NIST database. Thank you, American taxpayers!]
2. Starting With “Hunt And Peck” Is Not The Way To Go
Confronted with an IR spectrum of an unknown (and a sense of rising panic), what does a typical new student do?
They often reach for the first tool they are given, which is a table of common ranges for IR peaks given to them by their instructor.
The next step in their analysis is to go through the spectrum from one side to the next, trying to match every single peak to one of the numbers in the table. I know this because this is exactly what I did when I first learned IR. I call it “hunting and pecking”.
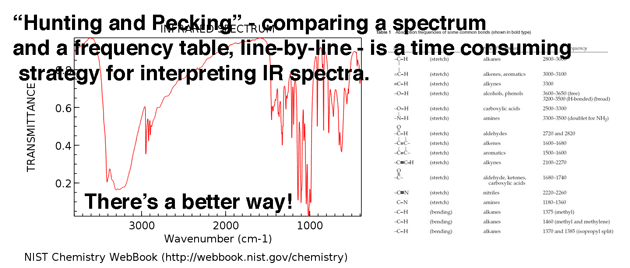
The only people who “hunt and peck” as their first step are people who have no plan (i.e. “newbies”).
So by reading the next few paragraphs you can save yourself a lot of time and confusion.
[Hunt and peck has its place, but only AFTER you’ve looked for “tongues” and “swords”, below. Hunting and pecking is great to make sure you didn’t miss anything big – but as a first step, it’s bloody awful!]
3. The Big Picture
In IR spectroscopy we measure where molecules absorb photons of IR radiation. The peaks represent areas of the spectrum where specific bond vibrations occur. [for more background, see the previous post, especially on the “ball and spring” model]. Just like springs of varying weights vibrate at characteristic frequencies depending on mass and tension, so do bonds.
Here’s an overview of the IR window from 4000 cm -1 to 500 cm -1 with various regions of interest highlighted.

An even more compressed overview looks like this: (source)
| 3600 – 2700 cm-1 | X-H (single bonds to hydrogen) |
| 2700 – 1900 cm-1 | X≡X (triple bonds) |
| 1900 – 1500 cm-1 | X=X (double bonds) |
| 1500 – 500 cm -1 | X–X (single bonds) |
Within these ranges, there are two high-priority areas to focus on, and two lesser-priority areas we’ll discuss further below. Chicken
4. The Two Main Things To Look For In An IR Spectrum: “Tongues” and “Swords”.
When confronted with a new IR spectrum, prioritize your time by asking two important questions:
- Is there a broad, rounded peak in the region around 3400-3200 cm-1 ? That’s where hydroxyl groups (OH) appear.
- Is there a sharp, strong peak in the region around 1850-1630 cm-1 ? That’s where carbonyl groups (C=O) show up.
First, let’s look at some examples of hydroxyl group peaks in the 3400 cm-1 to 3200 cm-1 region, which Jon describes vividly as “tongues”. The peaks below all belong to alcohols. Hydrogen bonding between hydroxyl groups leads to some variations in O-H bond strength, which results in a range of vibrational energies. The variation results in the broad peaks observed.
Hydroxyl groups that are a part of carboxylic acids have an even broader appearance that we’ll describe in a bit.
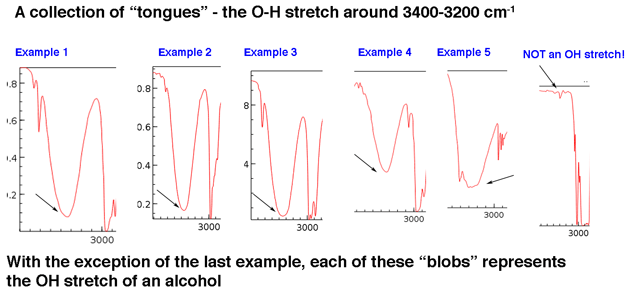
[Sometimes it helps to know what not to look for. On the far right hand side is included one example of a very weak peak on a baseline that you can safely ignore.]
The main point is that a hydroxyl group isn’t generally something you need to go looking for in the baseline noise.
Although hydroxyl groups are the most common type of broad peak in this region, N-H peaks can show up in this area as well (more on them in the Note 1). They tend to have a sharper appearance and may appear as one or two peaks depending on the number of N-H bonds.
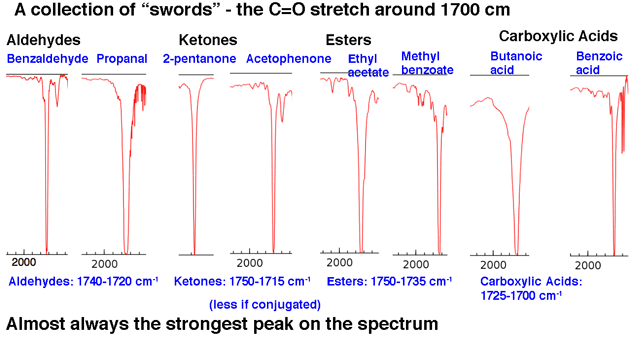
Next, let’s look at some examples of C=O peaks, in the region around 1630-1800 cm-1.. These peaks are almost always the strongest peaks in the entire spectrum and are relatively narrow, giving them a somewhat “sword-like” appearance.
That sums up our 80/20 analysis: look for tongues and swords.
If you learn nothing else from this post, learn to recognize these two types of peaks!
Two other regions of the IR spectrum can quickly yield useful information if you train yourself to look for them.
3. The line at 3000 cm-1 is a useful “border” between alkene C–H (above 3000 cm-1) and alkane C–H (below 3000 cm-1 ) This can quickly help you determine if double bonds are present.
4. A peak in the region around 2200 cm-1 – 2050 cm-1 is a subtle indicator of the presence of a triple bond [C≡N or C≡C] . Nothing else shows up in this region.
A Common Sense Reminder
First, some obvious advice:
- if you’re given the molecular formula, that will determine what functional groups you should look for. It makes no sense to look for OH groups if you have no oxygens in your molecular formula, or likewise the presence of an amine if the formula lacks nitrogen.
- Less obviously, calculate the degrees of unsaturation if you are given the molecular formula, because it will provide important clues. Don’t look for C=O in a structure like C4H10O which doesn’t have any degrees of unsaturation.
5. Alcohols and Carboxylic Acids: More Detail
Alcohols
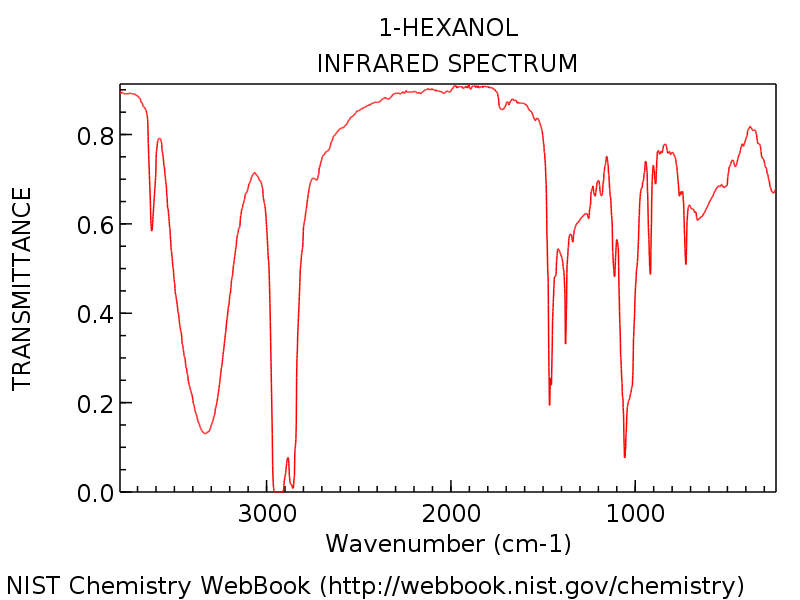
Let’s look at a specific example so we can see everything in perspective. The spectrum below is of 1-hexanol.
Note the hydroxyl group peak around 3300 cm-1 , typical of an alcohol (That sharp peak around 3600 cm-1 is a common companion to hydroxyl peaks: it represents non-hydrogen bonded O-H).
As you’d expect for 1-hexanol, there isn’t any telltale carbonyl peak around 1700 cm-1. Beginners might be tempted to label that dagger-like strong peak at about 1450 cm-1 as a possible C=O stretch. It is not. (it’s likely a C-H bend). Variations only occur within a very narrow range, and you are extremely unlikely to see a C=O stretch much below 1650 cm-1. The more spectra you see, the better you’ll get at making these judgements.
To gain some familiarity with variation, here’s some more examples of entire IR spectra of various alcohols.
Carboxylic Acids
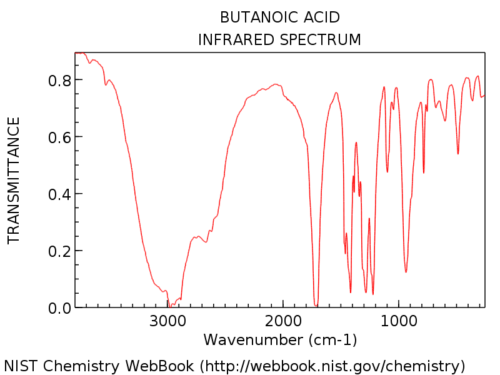
Hydroxyl groups in carboxylic acids are considerably broader than in alcohols. Jon calls it a “hairy beard”, which is a perfect description. Their appearance is also highly variable. The OH absorption in carboxylic acids can be so broad that it extends below 3000 cm-1 , pretty much “taking over” the left hand part of the spectrum.
Here’s an example: butanoic acid.
Here’s some more examples of full spectra so you can see the variation.
The difference in appearance between the OH of an alcohol and that of a carboxylic acid is usually diagnostic. In the rare case where you aren’t sure whether the broad peak is due to the OH of an alcohol or a carboxylic acid, one suggestion is to check the region around 1700 cm for the C=O stretch. If it’s absent, you are likely looking at an alcohol.
[Note 1 for more detail on the 3200-3500 cm-1 region : Amines, Amides, and Terminal Alkynes]
6. Specific Examples of IR Spectra of Carbonyl Functional Groups
The second important peak region is the carbonyl C=O stretch area at about 1630-1830 cm. Carbonyl stretches are sharp and strong.
Once you see a few of them they’re impossible to miss. Nothing else shows up in this region.
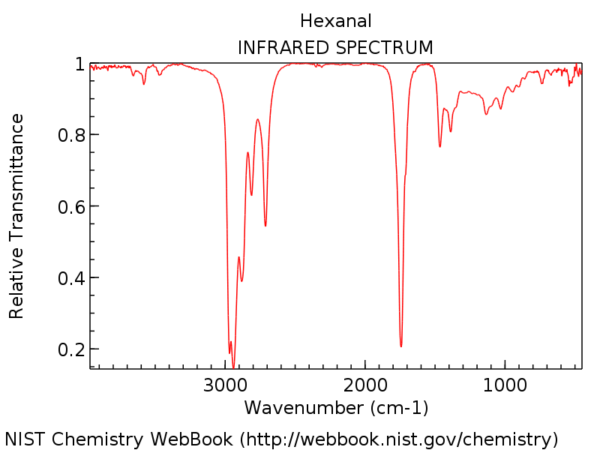
To put it in perspective, here’s the IR spectrum of hexanal. That peak a little after 1700 cm-1 is the C=O stretch. When it’s present, the C=O stretch is almost always the strongest peak in the IR spectrum and impossible to miss.
The position of the C=O stretch varies slightly by carbonyl functional group. Some ranges (in cm-1 ) are shown below:
- Aldehydes (1740-1690): benzaldehyde, propanal, pentanal
- Ketones (1750-1680): 2-pentanone, acetophenone
- Esters (1750-1735): ethyl acetate, methyl benzoate
- Carboxylic acids (1780-1710): benzoic acid, butanoic acid
- Amide (1690-1630): acetamide, benzamide, N,N-dimethyl formamide (DMF)
- Anhydrides (2 peaks; 1830-1800 and 1775-1740): acetic anhydride, benzoic anhydride
Conjugation will affect the position of the C=O stretch somewhat, moving it to lower wavenumber.
A decent rule of thumb is that you will never, ever see a C=O stretch below 1630. If you see a strong peak at 1500, for example, it is not C=O. It is something else.
7. Less Crucial, But Still Useful: Two More Very Diagnostic Areas.
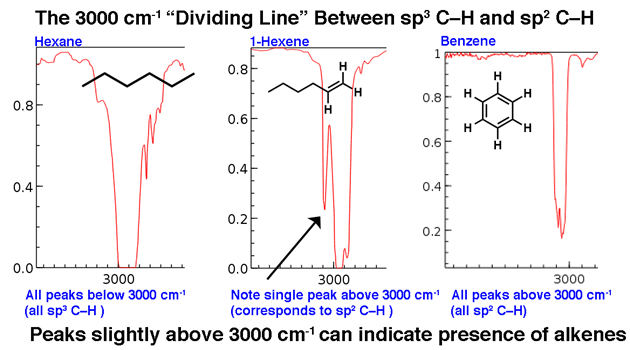
- The C-H Stretch Boundary at 3000 cm-1
3000 cm-1 serves as a useful dividing line. Above this line is observed higher frequency C-H stretches we attribute to sp2 hybridized C-H bonds. Two examples below: 1-hexene (note the peak that stands a little higher) and benzene.
For a molecule with only sp3-hybrized C-H bonds, the lines will appear below 3000 cm-1 as in hexane, below.
2. The Distinctive Triple Bond Region around 2200 cm-1
Molecules with triple bonds appear relatively infrequently in the grand scheme of things, but when they do, they do have a distinctive trace in the IR.
The region between 2000 cm-1 and 2400 cm-1 is a bit of a “ghost town” in IR spectra; there’s very little that appears in this region. If you do see peaks in this region, a likely candidate is a triple bonded carbon such as an alkyne or nitrile.
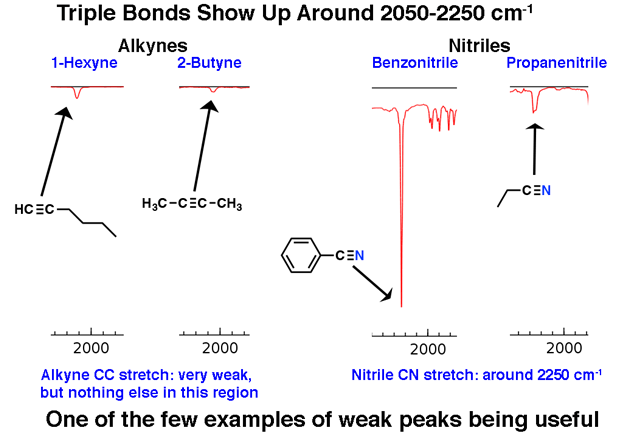
Note how weak the alkyne peaks are. This is one exception to the rule that one should ignore weak peaks. Still, caution is required: if you’re given the molecular formula, confirm that an alkyne is possible by calculating the degrees of unsaturation and ensuring that it is at least 2 or more.
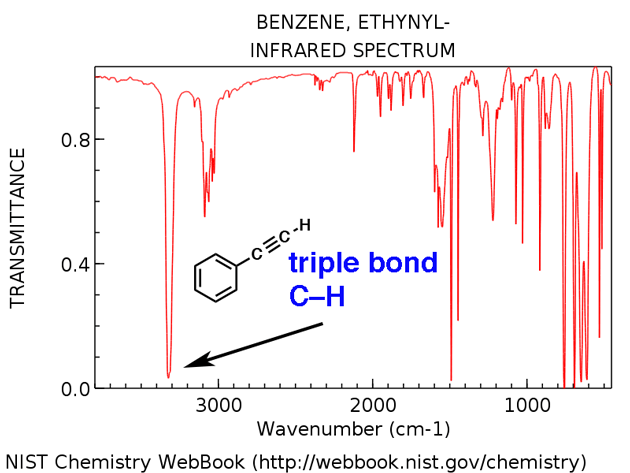
Terminal alkynes (such as 1-hexyne) also have a strong C-H stretch around 3400 cm-1 that is more strongly diagnostic.
8. Glucose, Revisited: The 1 Minute Analysis
OK. We’ve gone over 4 regions that are useful for a quick analysis of an IR spectrum.
- (important!) O-H around 3200-3400 cm-1
- (important!) C=O around 1700 cm-1
- C-H dividing line at 3000 cm-1
- (rare) Triple bond region around 2050-2250 cm-1
Now let’s go back and look at the IR of glucose. What do we see?
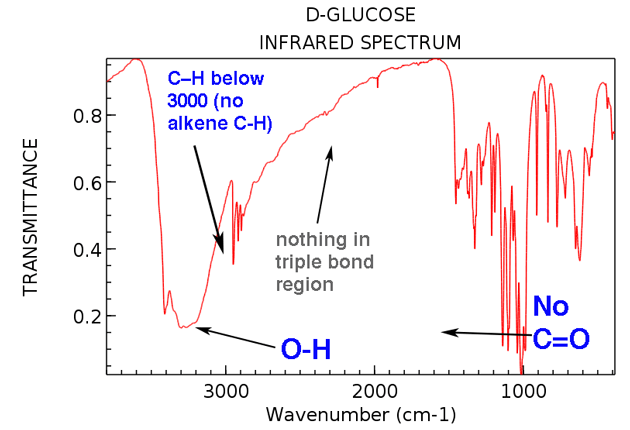
Here are the two big things to note:
- OH present around 3300 cm-1 . (in fact, this was included as one of the “swords” in section #3, above)
- No C=O stretch present. No strong peak around 1700 cm-1 . (The peak at 1450 cm-1 isn’t a C=O stretch).
Also, if we take a bit of extra time we can see:
- No alkene C-H (no peaks above 3000 cm-1 )
- Nothing in triple bonded region (rare, but still an easy thing to learn to check)
Now: If you were given this spectrum as an “unknown” along with its molecular formula, C6H12O6, what conclusions could you draw about its structure?
- The molecule has at least one OH group (and possibly more)
- The molecule doesn’t have any C=O groups
- The molecule *likely* doesn’t have any alkenes. If any alkenes are present, they don’t bear any C-H bonds, because we’d see their C-H stretch above 3000 cm-1.
A molecule with one degree of hydrogen deficiency (C6H12O6) but no C=O, and likely no C=C ?
A good guess would be that the molecule contains a ring. (We know this is the case, of course, but it’s nice to see the IR confirming what we already know).
This is what a 1-minute analysis of the IR of glucose can tell us. Not the whole structure, mind you, but certainly some important bits and pieces.
That’s enough for today. In the next post we’ll do some more 1-minute analyses and give more concrete examples of how to use the information in an IR spectrum to draw conclusions about molecular structure.
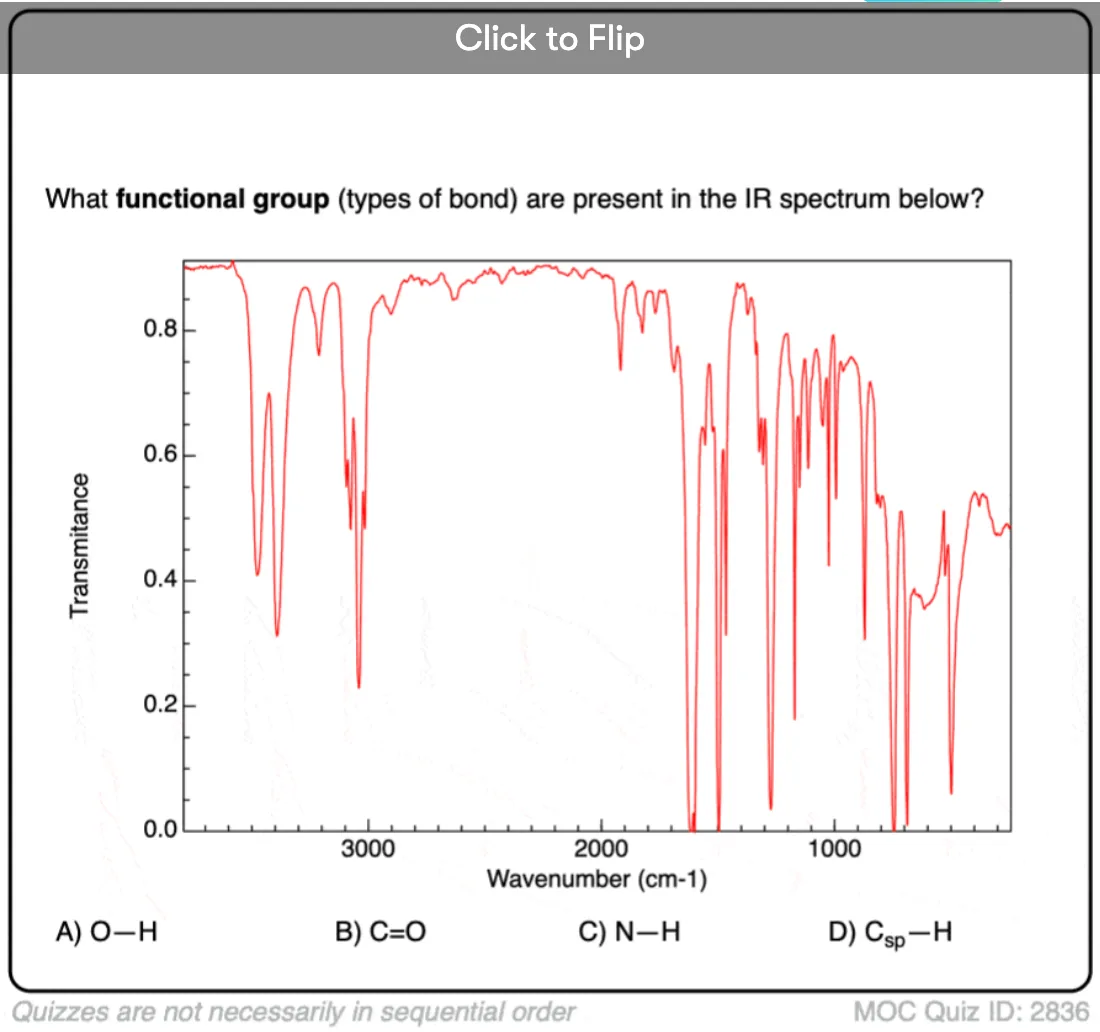
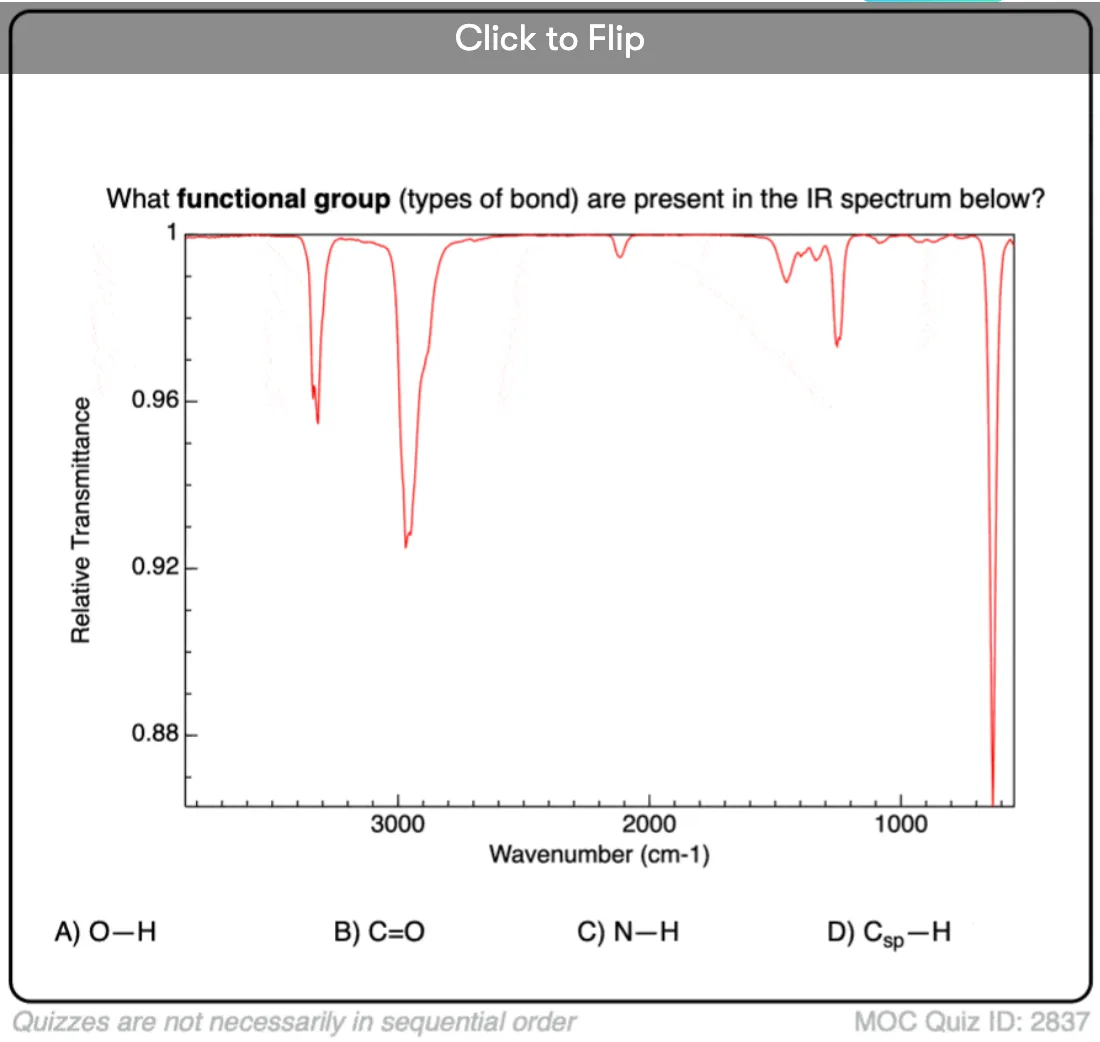
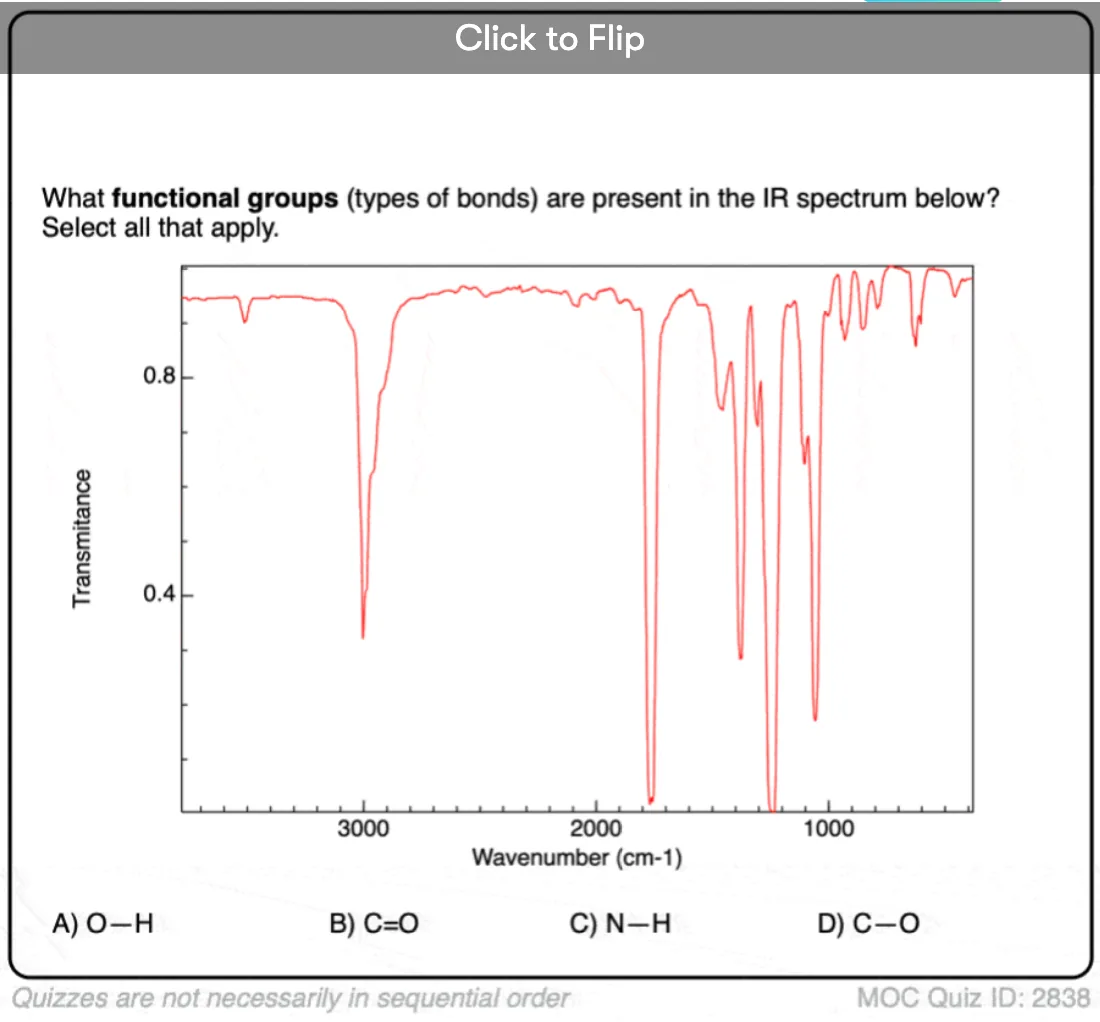
Quiz Yourself!
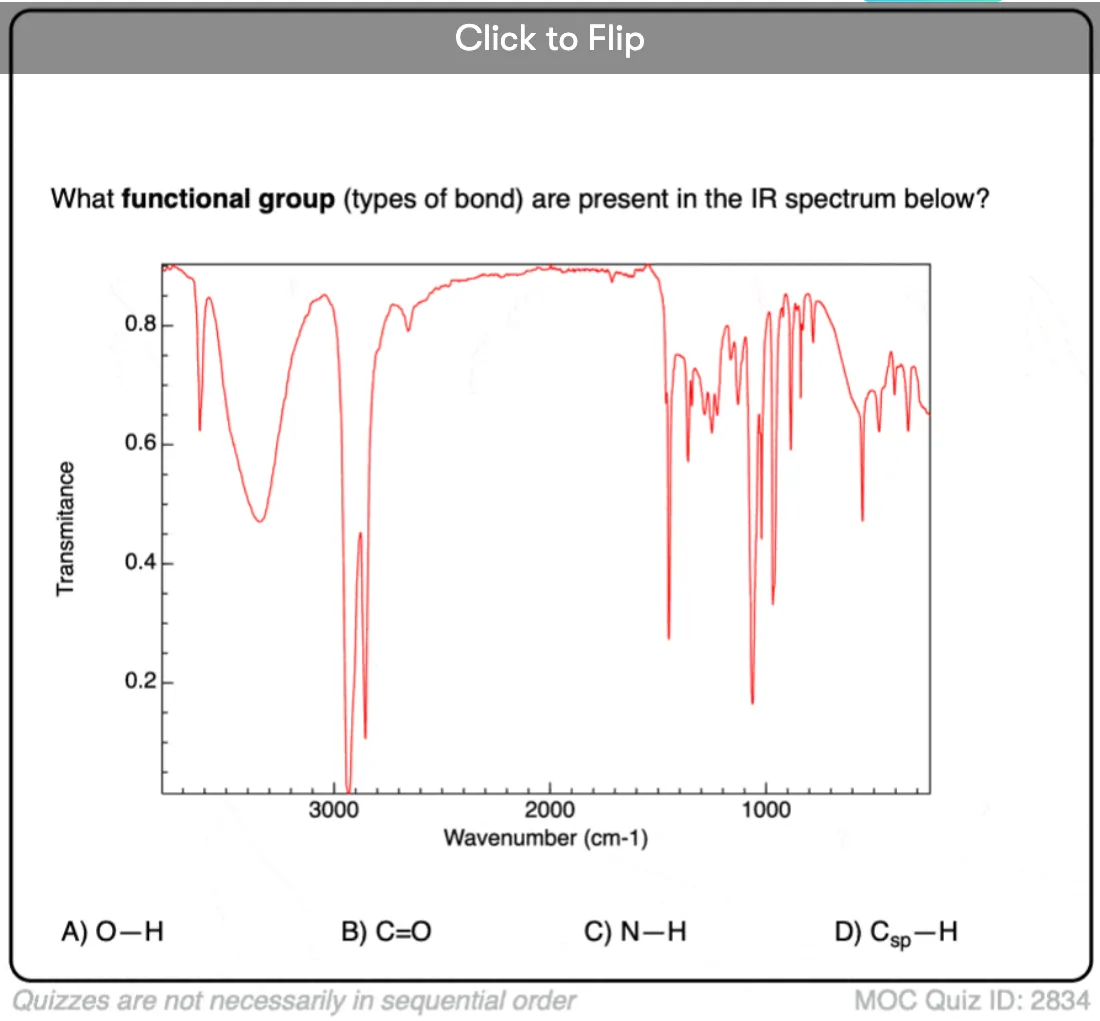
Become a MOC member to see the clickable quiz with answers on the back.
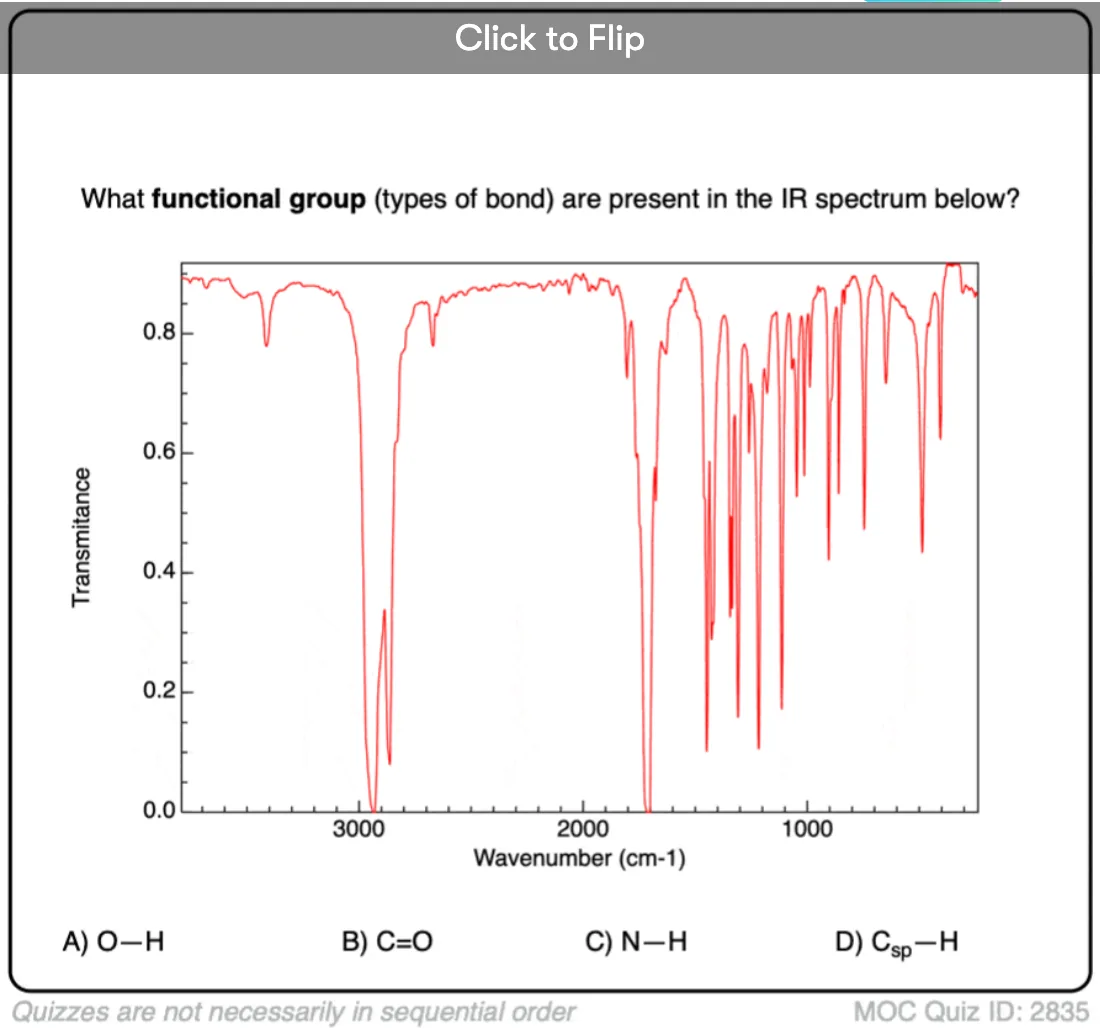
Become a MOC member to see the clickable quiz with answers on the back.
Become a MOC member to see the clickable quiz with answers on the back.
Become a MOC member to see the clickable quiz with answers on the back.
Become a MOC member to see the clickable quiz with answers on the back.
Notes
More on the 3200 region: Amines, Amides, and Terminal Alkyne C-H
While we’re in the 3200 region…. Amines and Amides
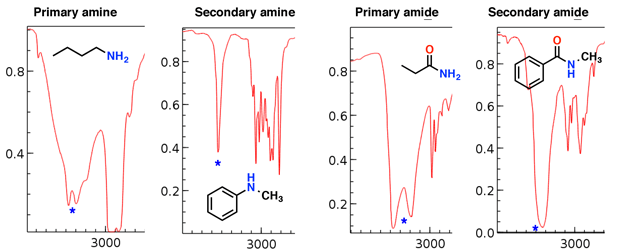
Amines and amides also have N-H stretches which show up in this region. [update: a comment from Paul Wenthold mentions some helpful advice about amides – they are rare – look for confirming evidence from the mass spectrum or other sources before assigning an amide based on a stretch in this region, as this region can also contain carbonyl “overtone” peaks]
Notice how the primary amine and primary amide have two “fangs”, while the secondary amine and secondary amide have a single peak.
The amine stretches tend to be sharper than the amide stretches; also the amides can be distinguished by a strong C=O stretch (see below).
Primary amines (click for spectra)
Secondary amines:
Primary amides
Secondary amides
Terminal alkyne C-H
Terminal alkynes have a characteristic C-H stretch around 3300 cm-1. Here it is for ethynylbenzene, below.
This article is very helpful for me. Thanks a lot.
Excellent.This is so useful.
Thank you so much for this. We cover so much material so quickly that it is easy to get lost in the sheer volume of it. It really helps to have things distilled into a more digestible and condensed format.
Thank you for this! May I ask, what if I would like to check whether Iron had been impregnated in my activated carbon? My study is FeCl3-impregnated activated carbon from coffee wastes. I have an IR spectra for the raw coffee waste and IR for the FeCl3- impregnated and thermally treated (700 deg. C) coffee wastes. What would be the expected difference in their spectra?
I don’t know. For trace metal analysis shouldn’t you be doing something like ICP or other techniques?
Ain’t this great! Man you’re an angel
this quick guide is awesome, I’ve learned so much reading it. To recall whatever you forgot over time, this is the best option.
Thank you
Glad you found it useful for refreshing your memory!
This has really been helpful for my studies in chemistry
I am glad you find it helpful Cirona!
This is very helpful
Glad you find it helpful Anand
I love this analysis very much impressive thanks 👍
Glad you find it helpful!
A lifesaver if there was ever one. Infrared Spectroscopy was so confusing for me in undergrad,and post grad had me even more muddled.One look at this article on the morning of the test was enough to make me take my test confidently and do it well! The way you simplified it while highlighting important points is crazy. I was trying to remember all the values given from the typical IR frequency table which wasn’t working at all and was leaving me anxious. Tongues and Swords made it so simple and memorable. Thanks for all that you do and more! This is Monica Rao all the way from India!
Glad to hear you found it useful! I had a similar experience in undergraduate and glad that this simplified things for you!
i love you, you just saved my life
explanation is very easy to understand. thank you
Best Explanation so far. Really helpful
VERY GOOD
This is so helpful thank you
Best Review on IR
Thank you Sagar.
Hi James,
Thank you for your very clear tutorials on interpreting IR spectra. They have been really helpful to me.
I have a few questions regarding a compound with an unknown structure, which I am trying to decipher using FTIR. Would you be happy to have a look at this for me and confirm whether or not I have done it right, based on the information on your tutorials?
Thanks I am newbie and this finally made a pathway in my grey cells :)
Thanks a lot. This has really helped me I understood everything in it
Thank you so much for this great work. I have one problem: I used to work with polymers (in my particular case I am working with PVC films). Firstly, I do an FTIR spectrum of the “as received” PVC film. Next, I carry out a thermal treatment of the PVC film (below its Tg) and repeat the FTIR. The peaks have not change, however the intensity of them is different. I have tried to figure out an explanation for this phenomenon (searching in bibliography), but I didn´t found an answer. Do you have any idea of why this happen?
thank you very much.
You are absolutely amazing. I feel so happy and satisfied reading this. Your style of presenting the context is so good. Thank You for your hard work for us.
Thank you so much. Two month i have struggled about this topic. Full of detail in simple words with various example. Thank you again
I am really grateful this lesson is really awesome.
Thank you so much!! Your post really helped understangding IR :)
Thank you so much for this great information sir
Thank you!! This is so easy explained and helpful. I have one question: How much can I trust in my software suggestions? the software of my FTIR instrumen has some libraries included.
I’m not sure. There can be considerable variability between samples of the same molecule, depending on how the sample is prepared (thickness of film) and the amount of water present (which affects hydrogen bonding). The libraries are a good starting point but not a magic bullet, good when part of a more holistic approach to combine with other information (e.g. HRMS data)
Thanks Paul – I was unaware of the overtones in that region. Very helpful, thank you!
One thing you didn’t mention is the carbonyl overtone peaks, which result when the molecule absorbs two photons of IR light. These show up as weak peaks at 2 x the carbonyl frequency, so are in that 3300 – 3500 range.
It’s important know about this because beginning students very often assign those peaks to NH stretches. And it’s not crazy, because NH stretches in monosubstituted amides can be relatively weak, so it can be difficult to distinguish them.
This isn’t perfect, but, from an instructor perspective, my advice is to avoid the urge to assign them to amine or amide. If you see a carbonyl, expect to see that overtone and don’t call it an NH stretch. Now, this means you might miss an amide, but that alone is not sufficient to conclude it is amide. You would need to verify it by other means. As noted, amide C=O stretches tend to be lower energy than other functional groups, but even then I’d be careful about putting too fine a point on it (absorptions usually come in ranges, not in specific spots – the C=O is 1680: does that mean it’s amide? Could be, but it could also be a ketone at the edge of its range; it’s consistent with both). Now, if you have a mass spectrum that indicates the presence of a N (by having an odd molecular mass), so you know N is present, then sure, it could be NH stretching. But absent other information that indicates an amide, my advice is don’t go that direction.
This is the best review I have ever seen-splendid!
This is an excellent resource on IR for a newbie…love to give this to my students for reading. Looking for posts on mass spectrometry..
Thanks Anju – appreciate it. This is what I wish someone told me when I was learning how to interpret IR spectra.
Very clear, lots of examples and well thought out instructions. I feel so much more confident! Thank you soo much!!!
Great! So glad you feel more confident!
Symply excellent. Please, we need MOC Text book.
Not happening! But thank you
Seriously it is the best of all explanation I have seen ,it really helpful 💖
Very helpful. I can understand the materials much better
Thanks for the wonderful lecture, my question is how can one identify aromatic or the benzene ring absorption. Please I also need your email address
Look for the C-H bond stretch below 3000 cm-1. It is not specific for the aromatic ring but at least points to an sp2 hybridized carbon bonded to H.
saved my life honestly.
Honestly? Awesome!
Best explanation ever ! The only one I understood .. Thank you a lot!
Thanks Olivia! Glad you found it helpful!
I was completely lost at lecture on IR but after reading this, i realized its simple things made difficult. You saved me a failure.
So glad to hear it Josan.
Thanks! This article saved me. Recommended this to all my friends.
Thanks for letting me know Harshit!
Wow! Thanks – you will never know how much time this saved me.
So glad to hear it Freeman.
Excellent explanation! Thank you for all the hard work.
Thanks Zeke!
Thank you! you just saved my life
If it made IR less painful, that’s awesome Alejandra!
I see nothing about <500 cm-1 which is what I need to know
Really? I wish I had a better answer for you. The region below 500 cm-1 is an “enduring mystery” for many of us. https://amphoteros.com/2019/01/18/an-enduring-mystery/
Loved this!!!!!
Great!
THANK YOU!!!! THIS SAVED MY LIFE!!!!!!
Hooray!
I know your faculty plans did not work out, but you are so better than many professors! Thank you! Never stop chasing your dreams!
Beautifully explained Sir !!
Best explanation of IR spectra I’ve came across.
Waiting for your next post :)
Thanks!
I completely agree with the above posts.
You should Youtube as well my friend. Great job!
I do have a Youtube channel but it has been quite neglected!
I COMPLETELY AGREE 100% with the previous praises and comments – you have been a SAVING grace in my organic chemistry understanding and I appreciate your approach in simplifying the most complex things. I have honestly spent 4+hrs in attempting 2 problems in figuring out the structures and feel so much better moving forward. THANK YOU! Keep up the phenomenal job!
Thank you Maribel!
Thanks for such a great focused article. It’s really very helpful.
Tried to make it useful. If it succeeded, great!
This is very clear and understandable even to a layman. Thanks a lot
You’re welcome!
why alkenes group (3000 -3100) & alkyl halides (500 -539) are added to NORYL (PPE + PS) plastic?
which properties are affected?
How do you know the peak in the 3000-3100 isn’t from the styrene?
Thank you so much for this guide! Very thorough approach and great explanation.
Meg – so glad you’ve found it helpful. Put a lot of work into it!
Great work! best I could find in all these years in fact.
Never using another website or youtube vid (unless its yours) for help again. You’re amazing
Beautifully explained!
This is the best review for IR Spectroscopy out there!
THIS IS SO HELPFUL!! so many different examples were used and I understand everything now! Will there be a quick tutorial for carbon and proton NMR as well?