Spectroscopy
Bond Vibrations, Infrared Spectroscopy, and the Ball and Spring Model
Last updated: June 2nd, 2026 |
The “Ball And Spring” Mental Model For Infrared Spectroscopy
Table of Contents
- Why do UV spectra have such broad peaks?
- The “stadium” analogy. Introduction to vibrational energy levels.
- Visualizing different vibrational energy levels
- A useful analogy: the “ball and spring” model for bond vibrations
- IR spectroscopy: a tool for observing bond vibrations
- How IR spectroscopy differs from UV spectroscopy
- A simple IR spectrum: H2O (water). How to tell the difference between the peaks and the baseline
- Some terms defined: transmission, absorbance, wavenumber
- Oh crap: a more complex IR spectrum. What do we do? (Don’t panic!)
- [Bonus track: using the “ball and spring model” to interpret IR spectra]
- Notes
1. Why Are Peaks In UV Spectra So Broad?
In the past series of posts on UV spectroscopy, we saw that UV or visible light can promote electrons from a lower energy orbital to a higher energy orbital, with the energy gap, delta E (ΔE) roughly corresponding to the wavelength of light.
By “roughly” I mean that we saw that UV spectra are not sharp.
Look at 1,3-butadiene, for instance (below). The λmax is 240 nm, but look how broad that region of the spectrum is: photons with wavelengths from about 235-245 nm (and beyond) will promote the same transition.
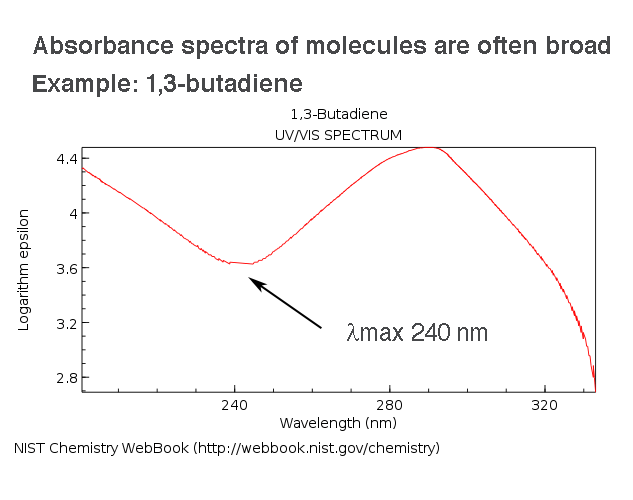
So why are energy levels so “smeared out” in molecules?
After all, we learn in general chemistry that energy levels are quantized, like the difference in energy between steps on a staircase. Why is there so much leeway?
You know what’s sharp? Atomic absorbance spectra. Look at sodium (below left). Look how crisply the lines at 589.0 nm and 589.6 nm are distinguished.
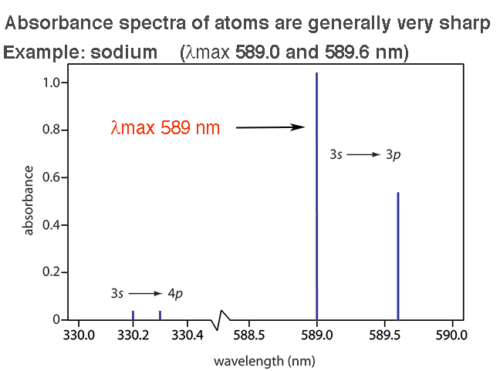
That’s more like it! We can visualize a difference of less than 1 nm of light in this atomic absorbance spectrum.
So what’s the difference?
2. Electronic and Vibrational Energy Levels: The Stadium Analogy
The brief answer is that electronic energy levels in atoms are quite simple: they are pure transitions between orbitals. There’s a few small technicalities (spin-orbit coupling: not going to get into that) but the peaks are sharp.
The situation complicates once covalent bonds enter the picture.
Chemical bonds behave a bit like flexible springs that connect two balls: they can vibrate, a general term we’ll use to cover such motions as stretching, bending, twisting, and others. At the molecular level, the energies of these motions are quantized: like steps on a staircase or ladder, each motion has a particular energy level.
The steps between these “vibrational” energy levels are much smaller than the “steps” we saw between electronic energy levels (i.e. orbitals) . In other words, less energy is required for transitions between vibrational energy levels than is required for electronic transitions.
You can visualize it a bit like this. It’s not perfect, but it gets the point across.
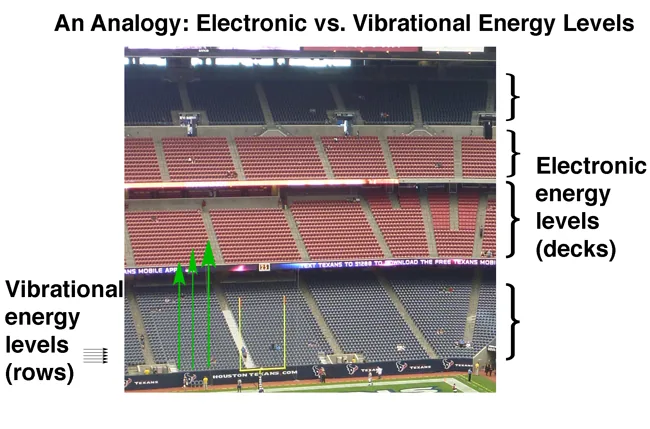
Think of the “decks” as the energy levels of orbitals, and the “rows” as the vibrational energy levels.
The existence of these vibrational energy levels explains why delta E can take on a range of values, and hence why UV spectra for molecules can be broad.
Why? Because each of the following would be a valid electronic transition between orbitals:
- Ground level, row 1 → Lower deck, row 1 (ΔE1)
- Ground level, row 1 → Lower deck, row 2 (ΔE2)
- Ground level, row 1 → Lower deck, row 3 (ΔE3)
- Ground level, row 1 → Lower deck, row 4 (ΔE4)
and so on.
The ΔE values should correspond to a series of absorbance peaks spaced out by the difference in energy between the vibrational energy levels (or the “spacing between rows” in our analogy).
In theory, we should be able to observe the spacing between these peaks (so-called “fine structure”). In practice, we tend not to, for reasons that aren’t that important for our purposes. [ If you’re desperate to know why not, Note 1.]
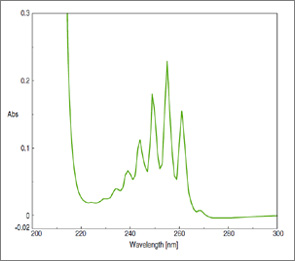
In rare cases we can see the fine structure in UV spectra, however. For example, look at the UV spectrum of benzene, below. See those individual peaks? Those represent transitions into individual vibrational energy levels.
We sometimes represent transitions from ground to excited states using a Franck-Condon diagram. You can think of it as a more rigorous version of our stadium analogy.
The bottom level (green line) attempts to show the spacing of vibrational energy levels in the ground state. Upon absorption of a photon of energy ΔE, an electron is promoted from the ground state to one of the vibrational levels in the excited state (red line). [Extra detail: The “minimum” of the green and red lines corresponds to the bond length in the ground and excited states respectively; they don’t overlap because the bond length in the excited state is longer. The F-C diagram is a useful model because electronic transitions are fast, relative to movements of atoms.]
This is more detail than you likely need. The “stadium analogy” is a perfectly fine intuitive model to use.
3. Visualizing Vibrational Energy Levels: The “Ball And Spring” Model
So how can we visualize exactly how these “vibrational energy levels” differ, and what they look like? And how do they relate to energy?
The “ball and spring” model is a great mental model to start with.
- Imagine two atoms (balls) attached by a spring (the bond).
- The spring allows for vibration to occur. We can visualize this vibration as standing waves.
- In a resting state we can imagine a simple standing wave with no nodes (i.e. no locations where the amplitude is zero) along its length.
- If the energy is increased by a certain integer amount corresponding to ΔE, a transition occurs to a higher vibrational energy level where the wave now has a single node. This is the first “excited” vibrational state.
- As more energy is applied to the system, additional energy levels will appear with an increasing number of nodes, roughly in integer increments of ΔE
The main idea of increased vibrational energy levels is conveyed by this GIF [Adapted from this video]
Higher frequency = more energy.
That’s the simple picture, which is enough for our purposes here.
[For a more rigorous mathematical description, you might want to read about quantum harmonic oscillators. More detail: not all atoms or vibrations are “IR-active”. Selection rules for vibrational transitions necessitate a change in dipole moment. This leads to several different types of vibration, such as bending, twisting, scissoring, and others, which are covered in the wikipedia article].
4. Two Quick Insights From The “Ball And Spring” Model
The Ball and Spring model can also help us make two important visualizations that will help make the interpretation of molecular vibration more intuitive.
1.The Effect of Mass. [Increasing Mass = Lower Frequency of Vibration]
- Take two balls connected by a spring. Given an input of energy, they will vibrate at a given frequency.
- Now: increase the mass of one of the balls. What happens to the frequency?
- It goes down. It’s a bit like the difference in sound between a thin metal guitar string and a thicker, heavier guitar string.
Translation: increasing the mass of an atom will decrease the frequency at which the bond vibrates. (and vice-versa: decreasing the mass will increase the vibrational frequency)
2. The Effect of Tension. [More Tension = Higher Frequency of Vibration]
- Take the two balls connected by a spring, as above.
- Now increase the strength of the spring, making it more stiff. What will happen to the frequency of vibration?
- It goes up. If you’ve ever tuned a guitar string, you can visualize this by the increase in pitch obtained as you tighten one of the tuning keys.
Translation: increasing the strength of a bond will increase the frequency at which the bond vibrates. (and vice-versa: weakening a bond will decrease the vibrational frequency)
Keep these two factors in mind as we go forward, because they will help you intuitively feel your way through our coverage of IR spectroscopy.
5. Infrared (IR) Spectroscopy Is Used To Observe Bond Vibrations
In UV-vis spectroscopy we saw that photons of wavelength 200-700 nm stimulated electronic transitions between orbitals.
From UV-Vis spectroscopy we are able to determine important clues about molecular structure: namely, it gives us an idea of how many pi bonds are present in a molecule, whether carbonyls (C=O) are present, whether or not pi bonds are conjugated, and so on.
Vibrational energy levels in bonds are stimulated by photons of wavelength 2500 – 25000 nm. [Recall that since E = hν and c = νλ , longer wavelength also means that these photons are lower energy than photons of visible light.]
This corresponds to the mid-infrared (IR) region of the spectrum.
This presents an idea: if we measure where a molecule absorbs infrared light, perhaps we can gain some clues about the nature of the bonds in a molecule!
This is the basic idea behind Infrared (IR) Spectroscopy! We expose a sample to infrared light and measure its absorbance versus the frequency. We then examine the pattern of peaks and valleys in the resulting spectrum.
It turns out to be a useful and powerful spectroscopic technique.
6. The Energies Involved In UV-Vis Spectroscopy Are About 30-40 Times Higher Than The Energies In Infrared Spectroscopy
Before we get started exploring this idea, two charts to help put things into perspective.
First, let’s call up a picture of the electromagnetic spectrum to give you an idea of where the appropriate wavelengths for IR spectroscopy fit in relation to those for UV-Vis spectroscopy. We care about the yellow band below. [Note that not all IR radiation is equally relevant for stimulating bond vibrations: for our purposes, we’ll only be concerned about the region in the yellow window (2500 nm to 25000 nm; alternatively 2.5 μm to 25 μm).]
Secondly, let’s put the energies into perspective.
Recall that a typical C-H bond has a strength (i.e. bond dissociation energy) of about 100 kcal/mol and the difference between the eclipsed and staggered forms of ethane are about 3 kcal/mol.
That is a pretty good comparison of the energies involved in UV-Vis spectroscopy and those in IR spectroscopy.
Ultraviolet radiation is energetic enough to promote electrons from lower energy orbitals up to higher energy orbitals, potentially leading to bond dissociation. [We use sunscreen for good reason! A single base-pair mutation caused by a stray UV photon could lead to DNA damage and possible cancer.]
In contrast, IR radiation is much more mild.
Here’s a quick table comparing the energies, wavelengths, and frequencies of UV-Vis and mid-IR radiation side by side.
7. A Simple IR Spectrum: Water
In UV-Vis spectroscopy, we generally plot the absorbance of a sample versus the wavelength of light. This gives us a “baseline” on the bottom of the graph which rises to peaks (absorbance maxima) in regions where the sample absorbs UV-Vis radiation. It looks like the cross-section of a mountain range. [There’s admittedly some variation here – UV-Vis spectra often are run in “transmittance” mode as well, such as the spectrum of butadiene at the top of the post]
In IR spectroscopy, we usually plot transmittance of a sample on the y axis versus wavenumber on the x axis. This give us a “baseline” on the top with “peaks” (actually “troughs”) pointing to the bottom. It looks like the cross-section of a measurement of the ocean floor or a lake.
In the olden days a device called a diffraction grating was used to scan a sample with a range of wavelengths (“continuous wave” spectroscopy) and a graph of wavelength versus absorbance would be obtained. In more modern times we use a technique called Fourier Transform Infrared Spectroscopy (FTIR) and subject the sample to all frequencies at once, and deconvolute the results using math. That’s beyond what I’ll get into here. Reusch and many others have more background on how spectrometers work.
8. Transmittance, Absorbance, Wavenumber
Let’s define some terms:
- Transmittance is the inverse of absorbance. A clear, colourless pane of glass has near 100% transmittance of visible light. A piece of coloured glass will have 100% transmittance at certain frequencies, while less transmittance (i.e. strong absorbance) at other frequencies. When we graph transmittance versus wavelength we obtain an appearance which is “flipped” in relation to a typical UV spectrum. The baseline is at the top, and “absorbance peaks” point towards the bottom, depending on the strength.
- Wavenumber is the inverse of wavelength (1/ λ) : it corresponds to the number of cycles in a given unit of length, and is thus a measure of frequency. The left-hand region of the spectrum (at 4000 cm-1) is high-frequency; the right-hand region (at about 400 cm-1) is low frequency.
You might ask: why “wavenumber” instead of wavelength? Good question! [Note 2].
Now let’s look at a relatively simple infrared spectrum. Here’s the IR spectrum of water.
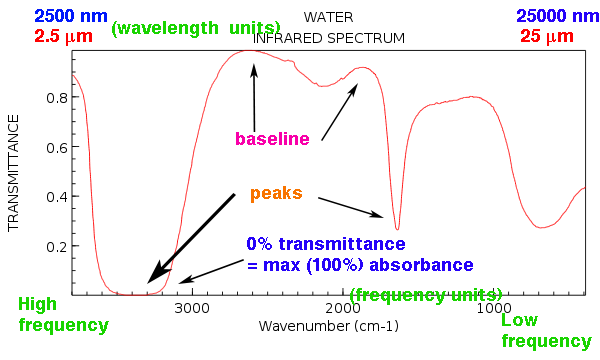
A few things to note:
- The region on the left (toward 4000 cm-1) corresponds to high frequency and short wavelength; the region on the right (toward 400 cm-1) corresponds to low frequency and long wavelength.
- The “baseline” at the top of the page is not very flat. That’s normal. We typically do something called “baseline correction” to try to make it look better, but that rarely makes it look perfect.
- The major “peaks” for water are at about 3200-3600 cm-1 (very broad and strong), 1600 cm-1 (relatively sharp) and then another peak around 700 cm-1 that is also quite broad.
- See that peak around 2200 that is weak and broad and somewhat undefined? That’s the kind of peak we typically ignore.
The most important thing to note is that each of these peaks corresponds to the vibration of a chemical bond in the sample which is being promoted by infrared light.
Hence, a different way of looking at it is that each molecule will give a characteristic “IR fingerprint” corresponding to the bonds present in the molecule.
9. A Not-So-Simple IR Spectrum. Oh Crap, What Do We Do?
For some perspective, let’s look at a not-so-simple IR spectrum.
Here’s an IR spectrum for glucose. You might expect that it should be more complex than water, and boy is it ever.
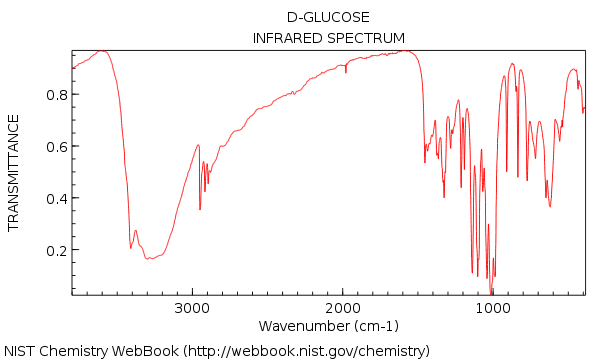
Crap, you might be thinking. Look at all those peaks!!!!
“Do I really have to know what each of them mean? “
The good news is no. Especially not in the region below 1000 cm-1.
10. Don’t Panic!
We’ll see that for most purposes, we can boil down an analysis of an IR spectrum to a relatively short exercise since we will mostly be using IR as a tool for identifying the presence (or absence) of specific functional groups.
We’ll leave that to the next post : Interpreting IR Spectra, A Quick Guide
[You can stop here if you like without missing much. However, if you want some more background on how to read IR spectra more intuitively, I’m including two extra examples below. ]
Bonus Track: The “Ball And Spring” Model of Bond Vibration, Illustrated With Two Examples
In the article above, we touched on the “ball and spring” model for bond vibration. Here, let’s expand on this by using some concrete examples in IR spectroscopy.
1. The Effect of Mass
First, we said that increasing the mass of one of the balls should lead to a decrease in the frequency of vibration.
One simple way to do this is to investigate the effect of isotopes on the vibrational frequency.
For example, we’ve already seen what the IR spectrum of H2O looks like.
Now: what happens when we replace hydrogen with deuterium?
This will effectively double the mass of one of the “balls” in each bond.
What effect do you predict this will have on the frequency of vibration? It should decrease significantly.
And that’s exactly what we see:
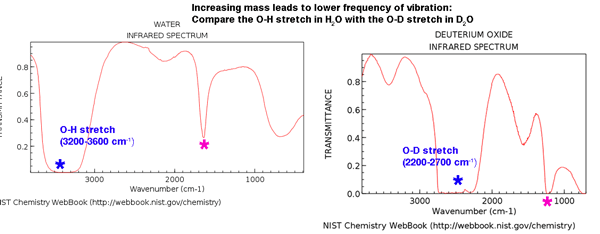
Note how that that big “blob” which was at 3200-3600 cm-1 (blue asterisk) has moved down to the region between about 2200-2700 cm-1 (lower frequency) as predicted. This corresponds to the frequency of vibration of an O-D bond.
It also occurs for the other O-H vibration which is indicated by the pink asterisk.
Note that we see such a dramatic effect because of the tremendous difference in mass between H and D (200%). The effect for other isotopes will be considerably lower. For example, the mass of 13C is only about 8% larger than that of 12C, and we should expect that the effect is much lower.
2. The Effect of Bond Strength
The second component of our mental model is that increasing the tension of the spring should increase the frequency. This correlates with increasing the bond strength between atoms.
Let’s run the test in our minds first.
Compare C-C versus C=C versus C≡C . Which bond is the strongest?
The triple bond C≡C , by far (835 kJ/mol or 200 kcal/mol, compared to 346 kJ/mol or 82 kcal/mol for the C-C single bond).
According to the “ball and spring” model, that means that its frequency of vibration should be the highest.
That’s indeed what we observe; the stronger the bond, the higher the vibration frequency.
This applies to bond order (single vs. double vs. triple bonds), as seen in this table:
It also applies to bonds of hydrogen connected to sp3, sp2, and sp-hybridized carbons, which have bond strengths of (roughly) 100 kcal/mol, 110 kcal/mol, and 130 kcal/mol respectively.
We could go on. But this seems like a good place to stop. We can return to this theme as we continue with further posts on IR.
One final question.
Which do you think will have a higher absorption frequency: the C=O bond in ketones, or the C=O bond in amides? This is directly connected to what we’ve just been discussing.
Hint: think about the most important resonance forms of each.
Answer at the very bottom of the post.
Notes
Note 1: We generally don’t observe them because these vibrational energy levels are further broken up into smaller rotational energy levels, which have even smaller gaps in energy (in the microwave region). These rotational energy levels can be observed in the gas-phase spectra of very simple molecules like HCl. One of the reason why benzene has fine structure visible is because its rigidity cuts down on the number of available rotational energy states.
In the older literature (such as in the structure determination of deer tarsal gland pheromone) IR peaks were given in units of wavelength λ (in units of μm, or micrometers). Over time, common practice has changed over to wavenumber, 1/λ (in cm-1) . I think this is because “wavenumber” is a more intuitive unit to use:
- In talking about vibration, it helps to use the “ball and spring” mental model.
- Frequency is the most intuitive unit to use when discussing vibration (as opposed to wavelength) due to our vast experience with sound (e.g. stronger bond = tighter spring, analogous to higher tension on a string = vibrates at higher frequency).
- When we use “wavelength” on the x-axis, high numbers correspond to low energy (low frequency) and low numbers correspond to high energy (high frequency). This causes dissonance since you’re always inverting wavelength and frequency in your mind.
- Inverting the wavelength λ (in nm) to give the wavenumber 1/ λ (in cm-1) relieves the dissonance. Higher wavenumber now corresponds to higher frequency.
Discussion on Chemistry Stack Exchange here.
[answer to question: consider the resonance forms. draw a resonance form for each where the C-O is a single bond. In which functional group will that resonance forms will be more important: for a ketone, or for an amide? Therein lies the answer]
Thanks! The ball and spring model really helped me make sense of this!
This was a great post to understand the IR Spectroscopy from Scratch for beginners particularly , Thank you very much, Want more posts like this and more practice problems on that concept at the end of the post as well
Thank you so much
Its very helpful and described in a very simple way for the biginers.
Thanks a lot, that was very helpful
Great, thank you Samson.
This is awesome thank you! My chemistry professor is almost too smart for his own good to break down Uv Vis vs IR into simple components, but this helps a lot to piece together what he was talking about.
Hey – if this was helpful, that’s awesome. Glad to hear it.
Thank you, this helped me understand the differences between UV & IR better, which in turn helped me explain it to my students.
Glad it helped! Thanks!
Wow. This help me a lot with intuitively understanding UV and IR, especially the ball and spring model.
Awesome. Thanks for leaving the comment!